

Skip to content
Free Excel Tutorials
  • Home
  • Excel For Beginners
  • Excel Intermediate
  • Advanced Excel For Experts

Data Analysis

  • How to create running total in an Excel Table
  • Subtotal function in Excel
  • Excel Frequency Function Example
  • Conditional Formatting Rules in Excel
  • How To Remove Duplicates In Excel Column Or Row?

References

  • How to create dynamic named range with OFFSET in Excel
  • Complete List of Excel Lookup and Reference Functions, References and Examples
  • Basic INDEX MATCH approximate in Excel
  • How to use Excel COLUMN Function
  • Find Closest Match in Excel Using INDEX, MATCH, ABS and MIN functions

Data Validations

  • Excel Data validation number multiple 100
  • Excel Data validation with conditional list
  • Excel Data validation unique values only
  • Excel Data validation must contain specific text
  • Excel Data validation must begin with

Things you find in Excel Status Bar

by

The quickest way to see the average, count, numerical count, minimum, maximum or sum of selected cells is by taking a look at the status bar.

1. Select a range of cells.
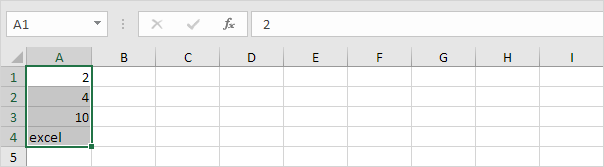
2. Look at the status bar at the bottom of your window to see the sum of these cells.

3. Right click the status bar to add the average, count, numerical count, minimum or maximum.
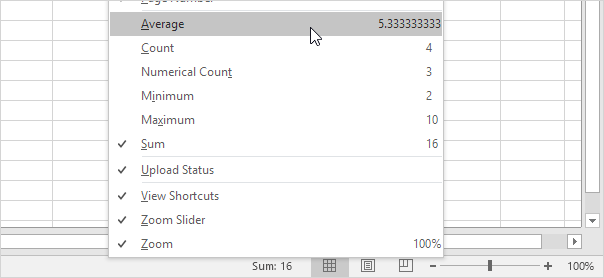
Result:

Post navigation

Previous Post:

VLOOKUP without #N/A error in Excel

Next Post:

Manipulating text strings using Left, Mid, Right, Len, Substitute in Excel

Leave a Reply Cancel reply

Your email address will not be published. Required fields are marked *

Learn Basic Excel

Ribbon
Workbook
Worksheets
Format Cells
Find & Select
Sort & Filter
Templates
Print
Share
Protect
Keyboard Shortcuts

Categories

  • Charts
  • Data Analysis
  • Data Validation
  • Excel Functions
    • Cube Functions
    • Database Functions
    • Date and Time Functions
    • Engineering Functions
    • Financial Functions
    • Information Functions
    • Logical Functions
    • Lookup and Reference Functions
    • Math and Trig Functions
    • Statistical Functions
    • Text Functions
    • Web Functions
  • Excel VBA
  • Excel Video Tutorials
  • Formatting
  • Grouping
  • Others

Logical Functions

  • NOT function: Description, Usage, Syntax, Examples and Explanation
  • How to use Excel NOT Function
  • IFNA function: Description, Usage, Syntax, Examples and Explanation
  • AND function: Description, Usage, Syntax, Examples and Explanation
  • How to use Excel TRUE Function

Date Time

  • Add decimal hours to time in Excel
  • How to calculate Next working/business day in Excel
  • Get first day of month in Excel
  • How to calculate workdays per month in Excel
  • DAYS360 function: Description, Usage, Syntax, Examples and Explanation

Grouping

  • Group times into unequal buckets in Excel
  • Group numbers with VLOOKUP in Excel
  • Calculate conditional mode with criteria in Excel
  • Map text to numbers in Excel
  • Group times into 3 hour buckets in Excel

General

  • How to count total columns in range in Excel
  • How to create dynamic worksheet reference in Excel
  • How to calculate profit margin percentage in Excel
  • Customize Ribbon In Excel
  • Subtotal by color in Excel
© 2026 xlsoffice . All Right Reserved. | Teal Smiles | Abbreviations And Their Meaning