
Skip to content
Free Excel Tutorials
  • Home
  • Excel For Beginners
  • Excel Intermediate
  • Advanced Excel For Experts

Data Analysis

  • How to calculate average last N values in a table in Excel
  • How to combine 2 or more chart types in a single chart in Excel
  • How to count table rows in Excel
  • Remove Duplicates Example in Excel
  • How To Perform and Interpret Regression Analysis in Excel

References

  • How to use Excel VLOOKUP Function
  • How to use Excel FORMULATEXT function
  • Find closest match in Excel
  • How to get relative row numbers in a range in Excel
  • Count unique text values with criteria

Data Validations

  • Excel Data validation must contain specific text
  • Excel Data validation whole percentage only
  • Prevent invalid data entering in specific cells
  • Excel Data validation with conditional list
  • Excel Data validation allow weekday only

Basic numeric sort formula in Excel

by

To dynamically sort data that contains only numeric values, you can use a helper column and a formula created with the RANK and COUNTIF functions.

Formula

=RANK(A1,values)+COUNTIF(exp_rng,A1)-1
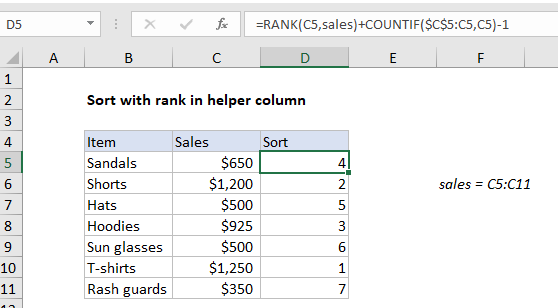
Note: this formula is the set-up for a formula that can extract and display data using a predefined sort order in a helper column. One example here.

Explanation

In the example shown, the formula in D5 is:

=RANK(C5,sales)+COUNTIF($C$5:C5,C5)-1

where “sales” is the named range C5:C11

How this formula works

The core of this formula is the RANK function, which is used to generate a rank of sales values, where the highest number is ranked #1:

=RANK(C5,sales)

Here, RANK uses the named range “sales” (C5:C11) for convenience. By default, RANK will assign 1 to the highest value, 2 to the second highest value, and so on. This works perfectly as long as numeric values are unique. However, to handle numeric values which contain duplicates, we need to use the COUNTIF function to break ties. This is done by adding the result of this snippet to the value returned by RANK:

COUNTIF($C$5:C5,C5)-1

Notice the range is entered as a mixed reference that will expand as the formula is copied down the table. As written, this reference will include the current row, so we subtract 1 to “zero out” the first occurrence. This means the expression will return zero for each numeric value until a duplicate is encountered. At the second instance, the expression will return 1, at the third instance, it will return 2, and so on. This effectively breaks ties, and allows the formula to generate a sequential list of numbers with no gaps.

Once the formula is in place, data can be sorted by the helper column. It can also be retrieved with INDEX using the values in the helper column.

Post navigation

Previous Post:

How to calculate project complete percentage in Excel

Next Post:

Popularly Used Excel Functions and their examples

Leave a Reply Cancel reply

Your email address will not be published. Required fields are marked *

Learn Basic Excel

Ribbon
Workbook
Worksheets
Format Cells
Find & Select
Sort & Filter
Templates
Print
Share
Protect
Keyboard Shortcuts

Categories

  • Charts
  • Data Analysis
  • Data Validation
  • Excel Functions
    • Cube Functions
    • Database Functions
    • Date and Time Functions
    • Engineering Functions
    • Financial Functions
    • Information Functions
    • Logical Functions
    • Lookup and Reference Functions
    • Math and Trig Functions
    • Statistical Functions
    • Text Functions
    • Web Functions
  • Excel VBA
  • Excel Video Tutorials
  • Formatting
  • Grouping
  • Others

Logical Functions

  • How to use Excel NOT Function
  • How to use Excel OR Function
  • Complete List of Excel Logical Functions, References and Examples
  • SWITCH function: Description, Usage, Syntax, Examples and Explanation
  • OR function: Description, Usage, Syntax, Examples and Explanation

Date Time

  • How to calculate workdays per month in Excel
  • MONTH function: Description, Usage, Syntax, Examples and Explanation
  • Dynamic date list in Excel
  • How to get number of days, weeks, months or years between two dates in Excel
  • DAYS360 function: Description, Usage, Syntax, Examples and Explanation

Grouping

  • How to randomly assign data to groups in Excel
  • Map inputs to arbitrary values in Excel
  • Group times into 3 hour buckets in Excel
  • How to randomly assign people to groups in Excel
  • Group arbitrary text values in Excel

General

  • Cell References: Relative, Absolute and Mixed Referencing Examples
  • How to generate random number between two numbers in Excel
  • How to choose page/paper size in Excel before Printing
  • Count cells that contain errors in Excel
  • Check if multiple cells have same value with case sensitive in Excel
© 2026 xlsoffice . All Right Reserved. | Teal Smiles | Abbreviations And Their Meaning