How to Sort by Color in Excel
Sorting data is an integral part of data analysis. You might want to arrange a list of names in alphabetical order, compile a list of product inventory levels from highest to lowest, or order rows by colors or icons.
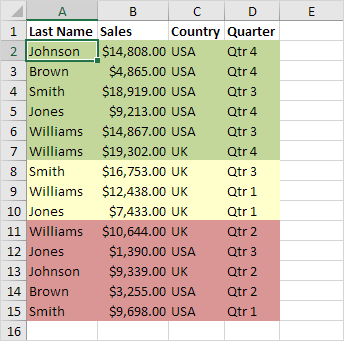
This example teaches you how to sort data by color in Excel.
1. Click any single cell inside a data set.
2. On the Data tab, in the Sort & Filter group, click Sort.

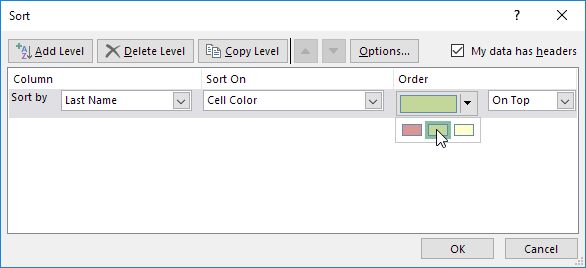
The Sort dialog box appears.
3. Sort by Last Name (or any other column), sort on Cell Color (you can also sort on Font Color and Cell Icon), and select the green color for the first level.
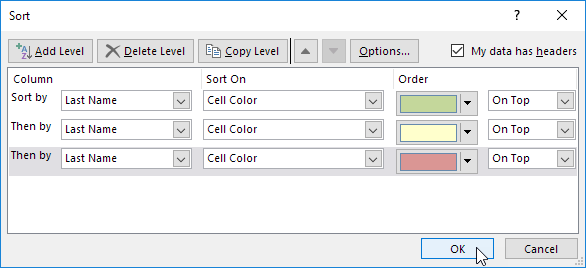
4. Click ‘Copy Level’ two times and select the other colors.
5. Click OK.
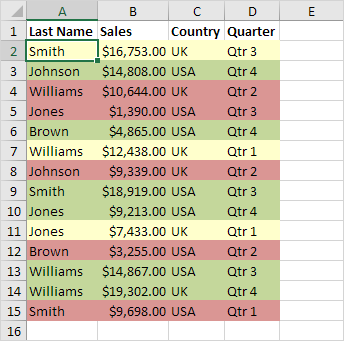
Result.