Skip to content
Free Excel Tutorials
  • Home
  • Excel For Beginners
  • Excel Intermediate
  • Advanced Excel For Experts

Data Analysis

  • Remove Duplicates Example in Excel
  • How To Sort One Column or Multiple Columns in Excel
  • Excel Pie Chart
  • How to calculate average last N values in a table in Excel
  • How to count table rows in Excel

References

  • How to get last row in mixed data with blanks in Excel
  • Basic INDEX MATCH approximate in Excel
  • Perform case-sensitive Lookup in Excel
  • How to get relative row numbers in a range in Excel
  • How to create dynamic named range with OFFSET in Excel

Data Validations

  • Data validation must not exist in list
  • Excel Data validation allow weekday only
  • Excel Data validation no punctuation
  • Excel Data validation whole percentage only
  • Excel Data validation require unique number

Excel Two-Way Lookup Example

by

This example teaches you how to lookup a value in a two-dimensional range. We use the INDEX and the MATCH function in Excel.

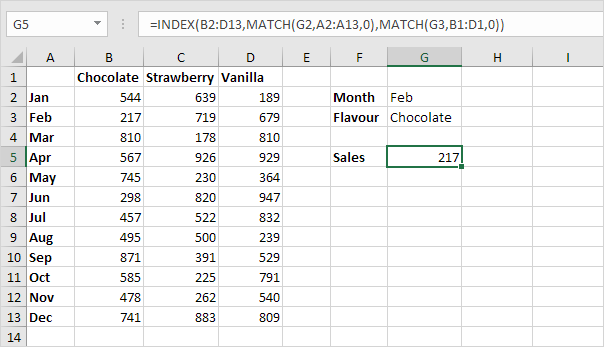
Below you can find the sales of different ice cream flavors in each month.

Worked Example:   How to calculate decrease by percentage in Excel

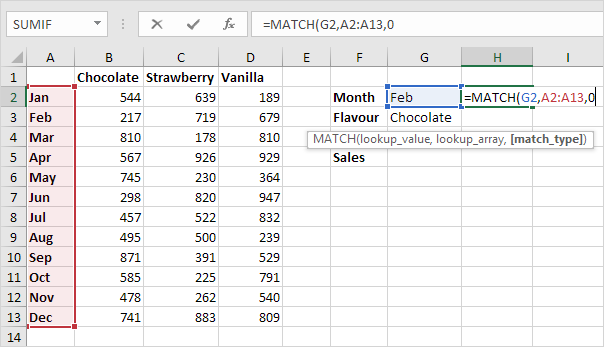
1. To find the position of Feb in the range A2:A13, use the MATCH function. The result is 2.

Worked Example:   How to calculate Number of Instances in Excel

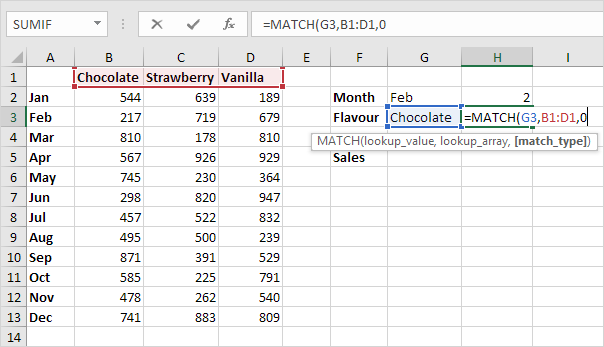
2. To find the position of Chocolate in the range B1:D1, use the MATCH function. The result is 1.

3. Use these results and the INDEX function to find the sales of Chocolate in February.

Worked Example:   How to get original number from percent change in Excel

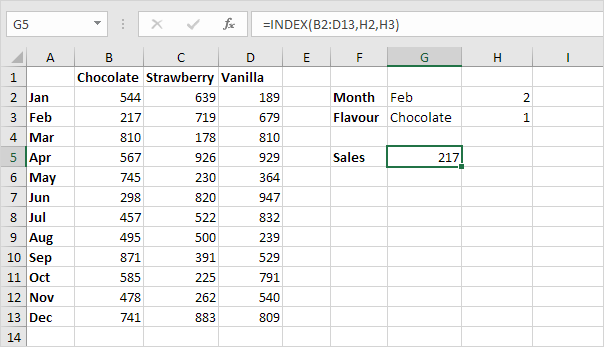
Explanation: 217 found at the intersection of row 2 and column 1 in the range B2:D13.

4. Put it all together.

Post navigation

Previous Post:

How to Create Column Chart in Excel

Next Post:

Excel Pie Chart

Leave a Reply Cancel reply

Your email address will not be published. Required fields are marked *

Learn Basic Excel

Ribbon
Workbook
Worksheets
Format Cells
Find & Select
Sort & Filter
Templates
Print
Share
Protect
Keyboard Shortcuts

Categories

  • Charts
  • Data Analysis
  • Data Validation
  • Excel Functions
    • Cube Functions
    • Database Functions
    • Date and Time Functions
    • Engineering Functions
    • Financial Functions
    • Information Functions
    • Logical Functions
    • Lookup and Reference Functions
    • Math and Trig Functions
    • Statistical Functions
    • Text Functions
    • Web Functions
  • Excel VBA
  • Excel Video Tutorials
  • Formatting
  • Grouping
  • Others

Logical Functions

  • How to use Excel NOT Function
  • FALSE function: Description, Usage, Syntax, Examples and Explanation
  • Nested IF function example in Excel
  • OR function Examples in Excel
  • OR function: Description, Usage, Syntax, Examples and Explanation

Date Time

  • TIME function: Description, Usage, Syntax, Examples and Explanation
  • Count holidays between two dates in Excel
  • How to calculate workdays per month in Excel
  • Get last weekday in month in Excel
  • Basic Overtime Calculation Formula in Excel

Grouping

  • Group times into 3 hour buckets in Excel
  • Group numbers at uneven intervals in Excel
  • Map text to numbers in Excel
  • Running count group by n size in Excel
  • Group arbitrary text values in Excel

General

  • Subtotal by invoice number in Excel
  • How to fill cell ranges with random number from fixed set of options in Excel
  • How to calculate profit margin percentage in Excel
  • How to set or clear a print area in Excel Worksheet
  • Zoom Worksheet in Excel
© 2023 xlsoffice . All Right Reserved. | Teal Smiles | Abbreviations And Their Meaning