Skip to content
xlsoffice. All Rights Reserved
  • Home
  • Excel For Beginners
  • Excel Intermediate
  • Advanced Excel For Experts

Lookup and Reference Examples

  • Offset in Excel
  • How to calculate two-way lookup VLOOKUP in Excel Table
  • How to get last row in mixed data with blanks in Excel
  • How to use Excel TRANSPOSE Function
  • Count rows that contain specific values in Excel

Data Analysis Examples

  • Conditional Formatting Rules in Excel
  • Excel Pie Chart
  • How to calculate correlation coefficient Correlation in Excel
  • How to create Gauge Chart in Excel
  • How to Create One and Two Variable Data Tables in Excel

Data Validation Examples

  • Excel Data validation unique values only
  • Excel Data validation exists in list
  • Excel Data validation must begin with
  • Prevent invalid data entering in specific cells
  • Excel Data validation don’t exceed total

How to combine 2 or more chart types in a single chart in Excel

by

Combination Chart: A combination chart is a chart that combines two or more chart types in a single chart.

To create a combination chart, execute the following steps.

1. Select the range A1:C13.

2. On the Insert tab, in the Charts group, click the Combo symbol.

3. Click Create Custom Combo Chart.
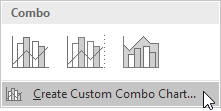
The Insert Chart dialog box appears.

4. For the Rainy Days series, choose Clustered Column as the chart type.

5. For the Profit series, choose Line as the chart type.

6. Plot the Profit series on the secondary axis.

7. Click OK.

Result:

Post navigation

Previous Post:

How to create Gauge Chart in Excel

Next Post:

Chart Axes in Excel

Leave a Reply Cancel reply

Your email address will not be published. Required fields are marked *

Learn Basic Excel

Ribbon
Workbook
Worksheets
Format Cells
Find & Select
Sort & Filter
Templates
Print
Share
Protect
Keyboard Shortcuts

Categories

  • Charts
  • Data Analysis
  • Data Validation
  • Excel Functions
    • Cube Functions
    • Database Functions
    • Date and Time Functions
    • Engineering Functions
    • Financial Functions
    • Information Functions
    • Logical Functions
    • Lookup and Reference Functions
    • Math and Trig Functions
    • Statistical Functions
    • Text Functions
    • Web Functions
  • Excel VBA
  • Excel Video Tutorials
  • Formatting
  • Grouping
  • Others
  • LEN, LENB functions: Description, Usage, Syntax, Examples and Explanation
  • How to extract domain name from URL in Excel
  • Remove text by position in a cell in Excel
  • How to find nth occurrence of character in Excel
  • How to extract substring in Excel
  • How to calculate next scheduled event in Excel
  • DAYS360 function: Description, Usage, Syntax, Examples and Explanation
  • Convert Excel time to Unix time in Excel
  • Convert Excel time to decimal hours in Excel
  • How to calculate working days left in month in Excel
  • How to set check register balance in Excel
  • TBILLPRICE function: Description, Usage, Syntax, Examples and Explanation
  • Calculate payment for a loan in Excel
  • DDB function: Description, Usage, Syntax, Examples and Explanation
  • COUPPCD function: Description, Usage, Syntax, Examples and Explanation
Acronyms, Abbreviations, Initialism & What They Stand For
© 2021 xlsoffice. All Rights Reserved | Teal Smiles