PRICE function: Description, Usage, Syntax, Examples and Explanation
What is PRICE function in Excel?
PRICE function is one of the Financial functions in Microsoft Excel that returns the price per $100 face value of a security that pays periodic interest.
Syntax of PRICE function
PRICE(settlement, maturity, rate, yld, redemption, frequency, [basis])
The PRICE function syntax has the following arguments:
- Settlement: The security’s settlement date. The security settlement date is the date after the issue date when the security is traded to the buyer.
- Maturity: The security’s maturity date. The maturity date is the date when the security expires.
- Rate: The security’s annual coupon rate.
- Yld: The security’s annual yield.
- Redemption: The security’s redemption value per $100 face value.
- Frequency: The number of coupon payments per year. For annual payments, frequency = 1; for semiannual, frequency = 2; for quarterly, frequency = 4.
- Basis (Optional): The type of day count basis to use.
Note: Dates should be entered by using the DATE function, or as results of other formulas or functions. For example, use DATE(2008,5,23) for the 23rd day of May, 2008. Problems can occur if dates are entered as text.
| Basis | Day count basis |
| 0 or omitted | US (NASD) 30/360 |
| 1 | Actual/actual |
| 2 | Actual/360 |
| 3 | Actual/365 |
| 4 | European 30/360 |
PRICE formula explanation
- Microsoft Excel stores dates as sequential serial numbers so they can be used in calculations. By default, January 1, 1900 is serial number 1, and January 1, 2008 is serial number 39448 because it is 39,448 days after January 1, 1900.
- The settlement date is the date a buyer purchases a coupon, such as a bond. The maturity date is the date when a coupon expires. For example, suppose a 30-year bond is issued on January 1, 2008, and is purchased by a buyer six months later. The issue date would be January 1, 2008, the settlement date would be July 1, 2008, and the maturity date would be January 1, 2038, which is 30 years after the January 1, 2008, issue date.
- Settlement, maturity, frequency, and basis are truncated to integers.
- If settlement or maturity is not a valid date, PRICE returns the #VALUE! error value.
- If yld < 0 or if rate < 0, PRICE returns the #NUM! error value.
- If redemption ≤ 0, PRICE returns the #NUM! error value.
- If frequency is any number other than 1, 2, or 4, PRICE returns the #NUM! error value.
- If basis < 0 or if basis > 4, PRICE returns the #NUM! error value.
- If settlement ≥ maturity, PRICE returns the #NUM! error value.
Important:
- When N > 1 (N is the number of coupons payable between the settlement date and redemption date), PRICE is calculated as follows:
- where:
- When N = 1 (N is the number of coupons payable between the settlement date and redemption date), PRICE is calculated as follows:
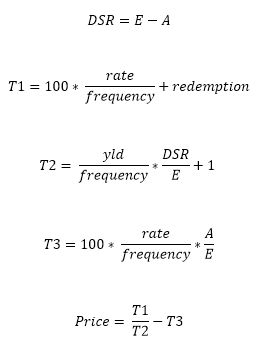
- DSC = number of days from settlement to next coupon date.
- E = number of days in coupon period in which the settlement date falls.
- A = number of days from beginning of coupon period to settlement date.
Example of PRICE function
Steps to follow:
1. Open a new Excel worksheet.
2. Copy data in the following table below and paste it in cell A1
Note: For formulas to show results, select them, press F2 key on your keyboard and then press Enter.
You can adjust the column widths to see all the data, if need be.
| Data | Argument description | |
| 2/15/2008 | Settlement date | |
| 11/15/2017 | Maturity date | |
| 5.75% | Percent semiannual coupon | |
| 6.50% | Percent yield | |
| $100 | Redemption value | |
| 2 | Frequency is semiannual | |
| 0 | 30/360 basis | |
| Formula | Description | Result |
| =PRICE(A2,A3,A4,A5,A6,A7,A8) | The bond price, for the bond with the arguments specified in cells A2:A8. | $94.63 |