Skip to content
Free Excel Tutorials
  • Home
  • Excel For Beginners
  • Excel Intermediate
  • Advanced Excel For Experts

Data Analysis

  • Example of COUNTIFS with variable table column in Excel
  • Create Scatter Chart in Excel
  • How to conditionally sum numeric data in an Excel table using SUMIFS
  • Excel Line Chart
  • How to Create Area Chart in Excel

References

  • Create hyperlink with VLOOKUP in Excel
  • How to reference named range different sheet in Excel
  • How to use Excel COLUMN Function
  • How to use Excel MMULT Function
  • Count rows with at least n matching values

Data Validations

  • Excel Data validation must not contain
  • Excel Data validation allow uppercase only
  • Excel Data validation allow weekday only
  • Excel Data validation specific characters only
  • Excel Data validation don’t exceed total

RAND vs RANDBETWEEN function examples in Excel

by
Excel has two useful functions when it comes to generating random numbers.
The RAND and RANDBETWEEN function.

Rand

The RAND function generates a random decimal number between 0 and 1.
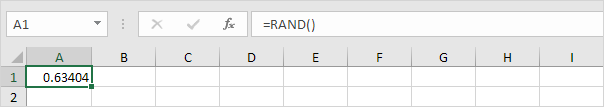
1. Select cell A1.

2. Type RAND() and press Enter. The RAND function has no arguments.

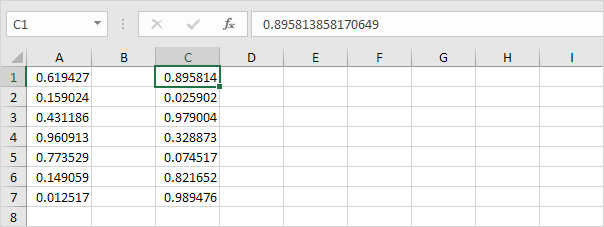
3. To generate a list of random numbers, select cell A1, click on the lower right corner of cell A1 and drag it down.

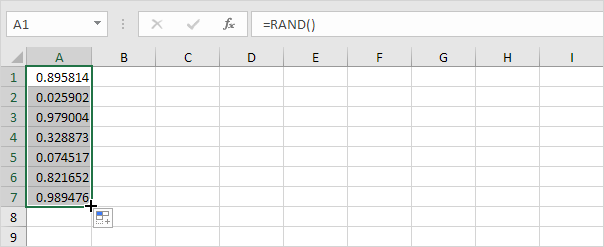
Note that cell A1 has changed. That is because random numbers change every time a cell on the sheet is calculated.

4. If you don’t want this, simply copy the random numbers and paste them as values.

5. Select cell C1 and look at the formula bar. This cell holds a value now and not the RAND function.

Randbetween

The RANDBETWEEN function generates a random whole number between two boundaries.
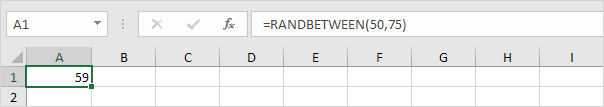
1. Select cell A1.

2. Type RANDBETWEEN(50,75) and press Enter.

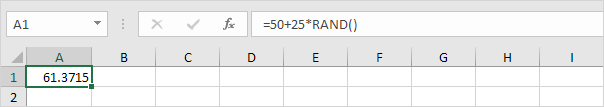
3. If you want to generate random decimal numbers between 50 and 75, modify the RAND function as follows:

Post navigation

Previous Post:

VLOOKUP without #N/A error in Excel

Next Post:

Manipulating text strings using Left, Mid, Right, Len, Substitute in Excel

Leave a Reply Cancel reply

Your email address will not be published. Required fields are marked *

Learn Basic Excel

Ribbon
Workbook
Worksheets
Format Cells
Find & Select
Sort & Filter
Templates
Print
Share
Protect
Keyboard Shortcuts

Categories

  • Charts
  • Data Analysis
  • Data Validation
  • Excel Functions
    • Cube Functions
    • Database Functions
    • Date and Time Functions
    • Engineering Functions
    • Financial Functions
    • Information Functions
    • Logical Functions
    • Lookup and Reference Functions
    • Math and Trig Functions
    • Statistical Functions
    • Text Functions
    • Web Functions
  • Excel VBA
  • Excel Video Tutorials
  • Formatting
  • Grouping
  • Others

Logical Functions

  • TRUE function: Description, Usage, Syntax, Examples and Explanation
  • IF function: Description, Usage, Syntax, Examples and Explanation
  • How to use IFS function in Excel
  • FALSE function: Description, Usage, Syntax, Examples and Explanation
  • SWITCH function: Description, Usage, Syntax, Examples and Explanation

Date Time

  • TIME function: Description, Usage, Syntax, Examples and Explanation
  • Get first day of month in Excel
  • Calculate date overlap in days in Excel
  • How to get Weekdays, Working days between Two Dates in Excel
  • TIMEVALUE function: Description, Usage, Syntax, Examples and Explanation

Grouping

  • Map inputs to arbitrary values in Excel
  • Calculate conditional mode with criteria in Excel
  • Running count group by n size in Excel
  • Group numbers at uneven intervals in Excel
  • If cell contains one of many things in Excel

General

  • How to calculate percent of students absent in Excel
  • Hide and Unhide Columns or Rows in Excel
  • Freeze and Unfreeze Panes in Excel
  • Basic text sort formula in Excel
  • How to count total columns in range in Excel
© 2025 xlsoffice . All Right Reserved. | Teal Smiles | Abbreviations And Their Meaning