Skip to content
Free Excel Tutorials
  • Home
  • Excel For Beginners
  • Excel Intermediate
  • Advanced Excel For Experts

Data Analysis

  • Add Outline to Data in Excel
  • How to Create Gantt Chart in Excel
  • Data Series in Excel
  • How To Load Analysis ToolPak in Excel
  • How To Remove Duplicates In Excel Column Or Row?

References

  • How to get last column number in range in Excel
  • Find Closest Match in Excel Using INDEX, MATCH, ABS and MIN functions
  • INDEX function: Description, Usage, Syntax, Examples and Explanation
  • How to get first column number in range in Excel
  • To count total rows in a range in Excel

Data Validations

  • Excel Data validation only dates between
  • Excel Data validation with conditional list
  • Excel Data validation must not contain
  • How To Create Drop-down List in Excel
  • Excel Data validation exists in list

Sum last n columns in Excel

by

This tutorial shows how to Sum last n columns in Excel using the example below;
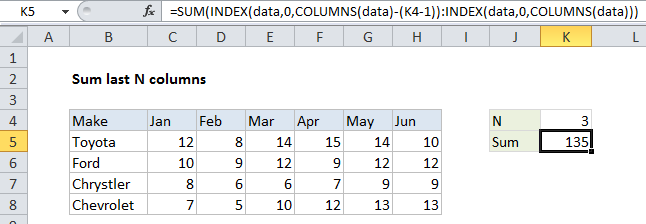
Formula

=SUM(INDEX(data,0,COLUMNS(data)-(n-1)):INDEX(data,0,COLUMNS(data)))

Explanation

To sum the last n columns in a table of data (i.e. last 3 columns, last 4 columns, etc.) you can use a formula based on the INDEX function. In the example shown, the formula in K5:

=SUM(INDEX(data,0,COLUMNS(data)-(K4-1)):
INDEX(data,0,COLUMNS(data)))

where “data” is the named range C5:H8

How this formula works

The key to understanding this formula is to realize that the INDEX function can be used to return a reference to entire rows and entire columns.

To generate a reference to the “last n columns” in a table, we build a reference in two parts, joined by the range operator. To get a reference to the left column, we use:

INDEX(data,0,COLUMNS(data)-(K4-1))

Since data contains 6 columns, and K4 contains 3, this simplifies to:

INDEX(data,0,4) // all of column 4

To get a reference to the right column in the range, we use:

INDEX(data,0,COLUMNS(data))

Which returns a reference to column 6 of the named range “data”, since the COLUMN function returns 6:

INDEX(data,0,6) // all of column 6

Together, the two INDEX functions return a reference to columns 4 through 6 in the data (i.e. F5:H8), which resolve to an array of values inside the SUM function:

SUM({15,14,10;9,12,12;7,9,9;12,13,13})

The SUM function then calculates and returns the sum, 135.

Post navigation

Previous Post:

How to use Excel CHOOSE Function

Next Post:

Customize Ribbon In Excel

Leave a Reply Cancel reply

Your email address will not be published. Required fields are marked *

Learn Basic Excel

Ribbon
Workbook
Worksheets
Format Cells
Find & Select
Sort & Filter
Templates
Print
Share
Protect
Keyboard Shortcuts

Categories

  • Charts
  • Data Analysis
  • Data Validation
  • Excel Functions
    • Cube Functions
    • Database Functions
    • Date and Time Functions
    • Engineering Functions
    • Financial Functions
    • Information Functions
    • Logical Functions
    • Lookup and Reference Functions
    • Math and Trig Functions
    • Statistical Functions
    • Text Functions
    • Web Functions
  • Excel VBA
  • Excel Video Tutorials
  • Formatting
  • Grouping
  • Others

Logical Functions

  • FALSE function: Description, Usage, Syntax, Examples and Explanation
  • SWITCH function example in Excel
  • IFERROR function: Description, Usage, Syntax, Examples and Explanation
  • IF function: Description, Usage, Syntax, Examples and Explanation
  • How to return blank in place of #DIV/0! error in Excel

Date Time

  • WEEKNUM function: Description, Usage, Syntax, Examples and Explanation
  • Calculate time difference in hours as decimal value in Excel
  • Convert date string to date time in Excel
  • Convert text date dd/mm/yy to mm/dd/yy in Excel
  • Add workdays to date custom weekends in Excel

Grouping

  • Calculate conditional mode with criteria in Excel
  • Group arbitrary text values in Excel
  • Map text to numbers in Excel
  • How to randomly assign data to groups in Excel
  • Map inputs to arbitrary values in Excel

General

  • Delete Blank Rows at Once in Excel
  • How to generate random number between two numbers in Excel
  • How to increase by percentage in Excel
  • Customize Ribbon In Excel
  • Print Excel Sheet In Landscape Or Portrait
© 2025 xlsoffice . All Right Reserved. | Teal Smiles | Abbreviations And Their Meaning