

Skip to content
Free Excel Tutorials
  • Home
  • Excel For Beginners
  • Excel Intermediate
  • Advanced Excel For Experts

Data Analysis

  • Excel Frequency Function Example
  • How To Insert and Customize Sparklines in Excel
  • Filter Data Based on Date in Excel
  • Chart Axes in Excel
  • How To Filter Data in Excel

References

  • Lookup entire row in Excel
  • How to get address of last cell in range in Excel
  • Find closest match in Excel
  • Two-way lookup with VLOOKUP in Excel
  • Last row number in range

Data Validations

  • Excel Data validation require unique number
  • Excel Data validation allow uppercase only
  • Excel Data validation date in specific year
  • Excel Data validation unique values only
  • Excel Data validation specific characters only

How to Create Gantt Chart in Excel

by

Illustrate Project Schedule in Gantt Chart

Excel does not offer Gantt as chart type, but it’s easy to create a Gantt chart by customizing the stacked bar chart type.

Below you can find our Gantt chart data.
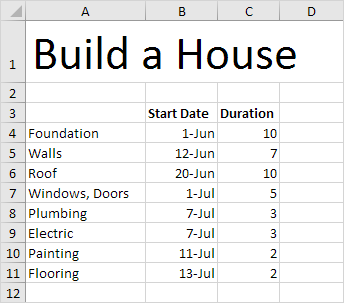
To create a Gantt chart, execute the following steps.

1. Select the range A3:C11.

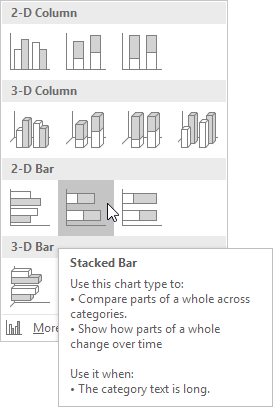
2. On the Insert tab, in the Charts group, click the Column symbol.

3. Click Stacked Bar.
Result:
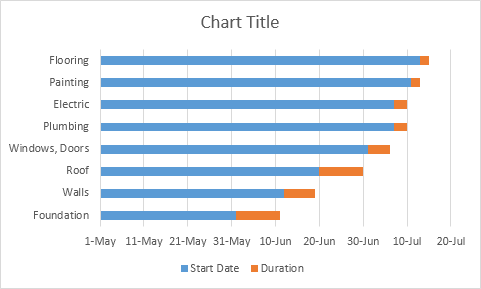
4. Enter a title by clicking on Chart Title. For example, Build a House.

5. Click the legend at the bottom and press Delete.

6. The tasks (Foundation, Walls, etc.) are in reverse order. Right click the tasks on the chart, click Format Axis and check ‘Categories in reverse order’.

Result:
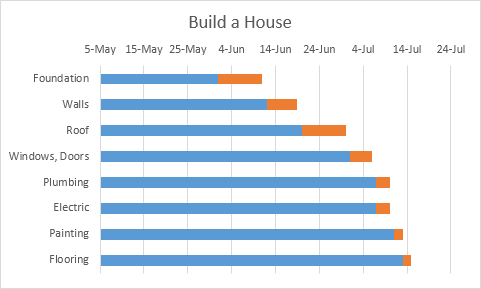
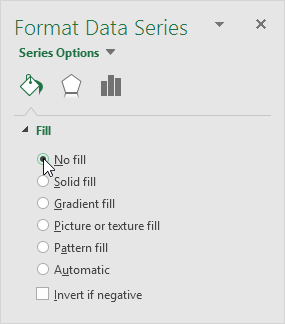
7. Right click the blue bars, click Format Data Series, Fill & Line icon, Fill, No fill.
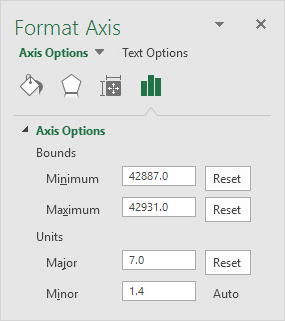
8. Dates and times are stored as numbers in Excel and count the number of days since January 0, 1900. 1-jun-2017 (start) is the same as 42887. 15-jul-2017 (end) is the same as 42931. Right click the dates on the chart, click Format Axis and fix the minimum bound to 42887, maximum bound to 42931 and Major unit to 7.
Result. A Gantt chart in Excel.

Note that the plumbing and electrical work can be executed simultaneously.

Post navigation

Previous Post:

COSH function: Description, Usage, Syntax, Examples and Explanation

Next Post:

Excel Data validation require unique number

Leave a Reply Cancel reply

Your email address will not be published. Required fields are marked *

Learn Basic Excel

Ribbon
Workbook
Worksheets
Format Cells
Find & Select
Sort & Filter
Templates
Print
Share
Protect
Keyboard Shortcuts

Categories

  • Charts
  • Data Analysis
  • Data Validation
  • Excel Functions
    • Cube Functions
    • Database Functions
    • Date and Time Functions
    • Engineering Functions
    • Financial Functions
    • Information Functions
    • Logical Functions
    • Lookup and Reference Functions
    • Math and Trig Functions
    • Statistical Functions
    • Text Functions
    • Web Functions
  • Excel VBA
  • Excel Video Tutorials
  • Formatting
  • Grouping
  • Others

Logical Functions

  • How to return blank in place of #DIV/0! error in Excel
  • How to use Excel XOR Function
  • NOT function: Description, Usage, Syntax, Examples and Explanation
  • Complete List of Excel Logical Functions, References and Examples
  • How to use Excel FALSE Function

Date Time

  • Convert text to date in Excel
  • Add days exclude certain days of week in Excel
  • How to join date and text together in Excel
  • Convert date string to date time in Excel
  • Display Date is same month in Excel

Grouping

  • Group numbers with VLOOKUP in Excel
  • Map inputs to arbitrary values in Excel
  • How to randomly assign people to groups in Excel
  • Group times into 3 hour buckets in Excel
  • Calculate conditional mode with criteria in Excel

General

  • Basic numeric sort formula in Excel
  • How to Delete Cells, Row and Rows in Excel
  • With vs Without Array Formula in Excel
  • Convert column number to letter in Excel
  • How to test a range for numbers in Excel
© 2026 xlsoffice . All Right Reserved. | Teal Smiles | Abbreviations And Their Meaning