Skip to content
Free Excel Tutorials
  • Home
  • Excel For Beginners
  • Excel Intermediate
  • Advanced Excel For Experts

Data Analysis

  • How to create dynamic reference table name in Excel
  • Conditional Formatting Data bars Examples in Excel
  • How to Create One and Two Variable Data Tables in Excel
  • Chart Axes in Excel
  • How to combine 2 or more chart types in a single chart in Excel

References

  • How to use Excel MATCH Function
  • Count rows that contain specific values in Excel
  • Find Closest Match in Excel Using INDEX, MATCH, ABS and MIN functions
  • How to use Excel MMULT Function
  • Create hyperlink with VLOOKUP in Excel

Data Validations

  • Excel Data validation with conditional list
  • Excel Data validation number multiple 100
  • Excel Data validation no punctuation
  • Excel Data validation must begin with
  • Excel Data validation allow uppercase only

Excel Bar Chart

by

A bar chart is the horizontal version of a column chart. Use a bar chart if you have large text labels.

To create a bar chart, execute the following steps.

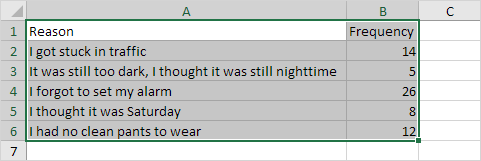
1. Select the range A1:B6.

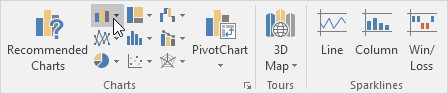
2. On the Insert tab, in the Charts group, click the Column symbol.

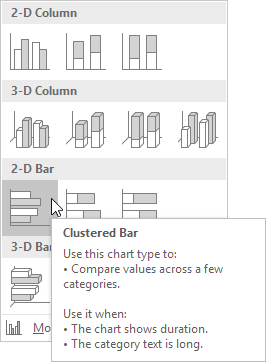
3. Click Clustered Bar.
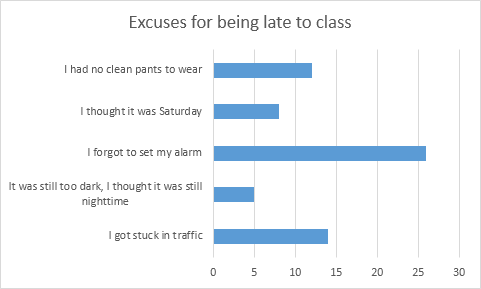
Result:


Post navigation

Previous Post:

VLOOKUP without #N/A error in Excel

Next Post:

Manipulating text strings using Left, Mid, Right, Len, Substitute in Excel

Leave a Reply Cancel reply

Your email address will not be published. Required fields are marked *

Learn Basic Excel

Ribbon
Workbook
Worksheets
Format Cells
Find & Select
Sort & Filter
Templates
Print
Share
Protect
Keyboard Shortcuts

Categories

  • Charts
  • Data Analysis
  • Data Validation
  • Excel Functions
    • Cube Functions
    • Database Functions
    • Date and Time Functions
    • Engineering Functions
    • Financial Functions
    • Information Functions
    • Logical Functions
    • Lookup and Reference Functions
    • Math and Trig Functions
    • Statistical Functions
    • Text Functions
    • Web Functions
  • Excel VBA
  • Excel Video Tutorials
  • Formatting
  • Grouping
  • Others

Logical Functions

  • How to use Excel OR Function
  • How to use Excel NOT Function
  • How to use Excel TRUE Function
  • AND function: Description, Usage, Syntax, Examples and Explanation
  • Extract multiple matches into separate rows in Excel

Date Time

  • Add years to date in Excel
  • How to calculate Quarter of Date in Excel
  • Get month from date in Excel
  • Convert time to time zone in Excel
  • NETWORKDAYS function: Description, Usage, Syntax, Examples and Explanation

Grouping

  • Calculate conditional mode with criteria in Excel
  • Categorize text with keywords in Excel
  • How to randomly assign data to groups in Excel
  • Group numbers with VLOOKUP in Excel
  • Group arbitrary text values in Excel

General

  • List sheet names with formula in Excel
  • Hide and Unhide Columns or Rows in Excel
  • AutoRecover file that was never saved in Excel
  • Freeze and Unfreeze Panes in Excel
  • How to calculate decrease by percentage in Excel
© 2025 xlsoffice . All Right Reserved. | Teal Smiles | Abbreviations And Their Meaning