Skip to content
Free Excel Tutorials
  • Home
  • Excel For Beginners
  • Excel Intermediate
  • Advanced Excel For Experts

Data Analysis

  • How To Sort One Column or Multiple Columns in Excel
  • How to conditionally sum numeric data in an Excel table using SUMIFS
  • Example of COUNTIFS with variable table column in Excel
  • How to Create Column Chart in Excel
  • Number and Text Filters Examples in Excel

References

  • How to use Excel MMULT Function
  • Two-column Lookup in Excel
  • How to get first row number in range in Excel
  • To count total rows in a range in Excel
  • How to get last row in numeric data in Excel

Data Validations

  • Excel Data validation specific characters only
  • Excel Data validation date in specific year
  • Excel Data validation number multiple 100
  • Excel Data validation unique values only
  • Excel Data validation with conditional list

Error Bars in Excel

by

Error bars are graphical representations of the variability of data and used on graphs to indicate the error or uncertainty in a reported measurement.

Excel error bars are used to display either the standard deviation, standard error, confidence intervals or the minimum and maximum values in a ranged dataset. To visualise this information, Error Bars work by drawing cap-tipped lines that extend from the centre of the plotted data point (or edge with Bar Charts).

This example teaches you how to add error bars to a chart in Excel.

1. Select the chart.

2. Click the + button on the right side of the chart, click the arrow next to Error Bars and then click More Options.

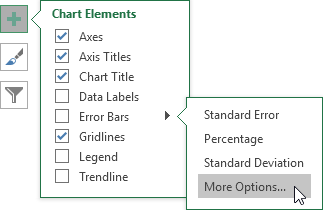
Notice the shortcuts to quickly display error bars using the Standard Error, a percentage value of 5% or 1 standard deviation.

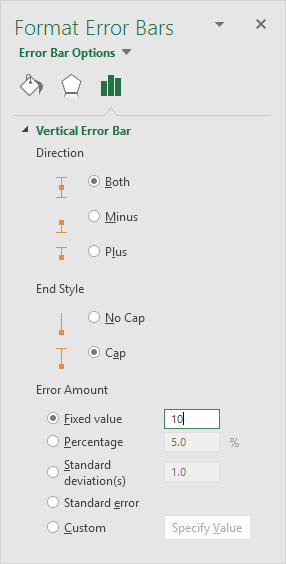
The Format Error Bars pane appears.

3. Choose a Direction. Click Both.

4. Choose an End Style. Click Cap.

5. Click Fixed value and enter the value 10.

Result:

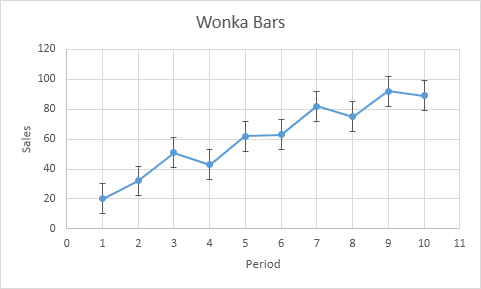
Note: if you add error bars to a scatter chart, Excel also adds horizontal error bars. In this example, these error bars have been removed. The vertical error bar in period 1 predicts 10 to 30 sold wonka bars, the vertical error bar in period 2 predicts 22 to 42 sold wonka bars, etc.

Post navigation

Previous Post:

VLOOKUP without #N/A error in Excel

Next Post:

Manipulating text strings using Left, Mid, Right, Len, Substitute in Excel

Leave a Reply Cancel reply

Your email address will not be published. Required fields are marked *

Learn Basic Excel

Ribbon
Workbook
Worksheets
Format Cells
Find & Select
Sort & Filter
Templates
Print
Share
Protect
Keyboard Shortcuts

Categories

  • Charts
  • Data Analysis
  • Data Validation
  • Excel Functions
    • Cube Functions
    • Database Functions
    • Date and Time Functions
    • Engineering Functions
    • Financial Functions
    • Information Functions
    • Logical Functions
    • Lookup and Reference Functions
    • Math and Trig Functions
    • Statistical Functions
    • Text Functions
    • Web Functions
  • Excel VBA
  • Excel Video Tutorials
  • Formatting
  • Grouping
  • Others

Logical Functions

  • How to return blank in place of #DIV/0! error in Excel
  • Complete List of Excel Logical Functions, References and Examples
  • Check multiple cells are equal in Excel
  • IF with wildcards in Excel
  • IFS function: Description, Usage, Syntax, Examples and Explanation

Date Time

  • Find Last Day of the Month in Excel
  • Convert date to text in Excel
  • MONTH function: Description, Usage, Syntax, Examples and Explanation
  • Display Date is same month in Excel
  • DATEVALUE function: Description, Usage, Syntax, Examples and Explanation

Grouping

  • Group arbitrary text values in Excel
  • If cell contains one of many things in Excel
  • Map text to numbers in Excel
  • Categorize text with keywords in Excel
  • Calculate conditional mode with criteria in Excel

General

  • How to calculate percentage discount in Excel
  • Find Most Frequently Occurring Word in Excel Worksheet
  • 3D SUMIF for multiple worksheets in Excel
  • How to count total number of cells in a rectangular range in Excel
  • How to calculate percent variance in Excel
© 2026 xlsoffice . All Right Reserved. | Teal Smiles | Abbreviations And Their Meaning