Skip to content
Free Excel Tutorials
  • Home
  • Excel For Beginners
  • Excel Intermediate
  • Advanced Excel For Experts

Data Analysis

  • Calculate Conditional Percentile ‘IF’ in table in Excel
  • How To Load Analysis ToolPak in Excel
  • How to add Trendline to a chart in Excel
  • How to create dynamic reference table name in Excel
  • What-If Analysis: Scenarios and Goal Seek in Excel

References

  • How to use Excel ROWS Function
  • How to create dynamic named range with OFFSET in Excel
  • How to get last row in text data in Excel
  • Offset in Excel
  • Merge tables with VLOOKUP in Excel

Data Validations

  • Excel Data validation require unique number
  • Excel Data validation specific characters only
  • Excel Data validation only dates between
  • Excel Data validation exists in list
  • Excel Data validation must contain specific text

Calculate total hours that fall between two times in Excel

by

Case study

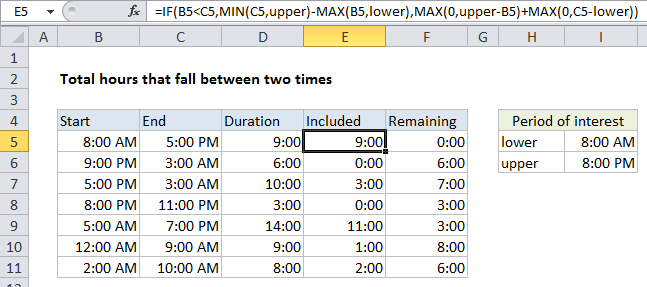
You have a start time and an end time, and you want to know how many of the hours in between these two times overlap another time period in the day. For example, you want to know how many hours fall between 8:00 AM and 5:00 PM, or 7:00 PM to 7:00 AM, etc.

You might need this information to calculate different hourly rates or different service charges depending on what time of day the work occurred. For instance, you might pay one rate for hours logged between 7:00 PM to 7:00 AM and a different rate for hours outside that period.

Formula

=IF(start<end,MIN(end,upper)-MAX(start,lower),MAX(0,upper-start)+MAX(0,end-lower))

Explanation

Approach

In this example, we first calculate the total hours between the start time and end time. Then we figure out the total hours that overlap “the period of interest”. Using these two values, we can figure out all remaining hours.

In all formulas, “lower” represents the first time (lower bound) in the time period of interest, and upper represents the second time (upper bound).

Formulas

To calculate total hours between start and end time, the formula in D5 is:

=MOD(C5-B5,1)

This formula is explained in more detail here.

The formula in E5 works in two parts, using IF to control flow. If the start time is less than the end time, we calculate the overlap with period of interest with:

MIN(C5,upper)-MAX(B5,lower)

If the start time is greater than end time (i.e. start time and end times cross a midnight), we  use:

MAX(0,upper-B5)+MAX(0,C5-lower)

By using MAX with zero, we prevent negative values from being used.

Finally, to figure out “Remaining” hours (i.e. hours that do not fall in the period of interest) we simply subtract E5 (included) from D5 (total duration).

Post navigation

Previous Post:

DECIMAL function: Description, Usage, Syntax, Examples and Explanation

Next Post:

AVERAGE function: Description, Usage, Syntax, Examples and Explanation

Leave a Reply Cancel reply

Your email address will not be published. Required fields are marked *

Learn Basic Excel

Ribbon
Workbook
Worksheets
Format Cells
Find & Select
Sort & Filter
Templates
Print
Share
Protect
Keyboard Shortcuts

Categories

  • Charts
  • Data Analysis
  • Data Validation
  • Excel Functions
    • Cube Functions
    • Database Functions
    • Date and Time Functions
    • Engineering Functions
    • Financial Functions
    • Information Functions
    • Logical Functions
    • Lookup and Reference Functions
    • Math and Trig Functions
    • Statistical Functions
    • Text Functions
    • Web Functions
  • Excel VBA
  • Excel Video Tutorials
  • Formatting
  • Grouping
  • Others

Logical Functions

  • Return blank if in Excel
  • Not Equal To ‘<>‘ operator in Excel
  • How to use Excel OR Function
  • SWITCH function example in Excel
  • Complete List of Excel Logical Functions, References and Examples

Date Time

  • Calculate retirement date in Excel
  • Get last day of month in Excel
  • How to calculate project start date based on end date in Excel
  • DATEVALUE function: Description, Usage, Syntax, Examples and Explanation
  • YEARFRAC function: Description, Usage, Syntax, Examples and Explanation

Grouping

  • Group arbitrary text values in Excel
  • Map inputs to arbitrary values in Excel
  • Group times into unequal buckets in Excel
  • Running count group by n size in Excel
  • How to randomly assign data to groups in Excel

General

  • Flash Fill in Excel
  • How to get Excel workbook path only
  • How to Delete Cells, Row and Rows in Excel
  • How to count total number of cells in a rectangular range in Excel
  • Spell Check in Excel
© 2026 xlsoffice . All Right Reserved. | Teal Smiles | Abbreviations And Their Meaning