Skip to content
Free Excel Tutorials
  • Home
  • Excel For Beginners
  • Excel Intermediate
  • Advanced Excel For Experts

Data Analysis

  • Understanding Anova in Excel
  • Conditional Formatting Rules in Excel
  • Filter Data Based on Date in Excel
  • How To Sort One Column or Multiple Columns in Excel
  • How To Remove Duplicates In Excel Column Or Row?

References

  • How to use Excel LOOKUP Function
  • Extract all partial matches in Excel
  • How to get address of named range in Excel
  • How to use Excel INDIRECT Function
  • How to use Excel ROW Function

Data Validations

  • Excel Data validation don’t exceed total
  • Excel Data validation must begin with
  • Excel Data validation only dates between
  • Excel Data validation whole percentage only
  • Excel Data validation specific characters only

How to Create Thermometer Chart in Excel

by

Thermometer chart shows you how much of a goal has been achieved.

This example teaches you how to create a thermometer chart in Excel.

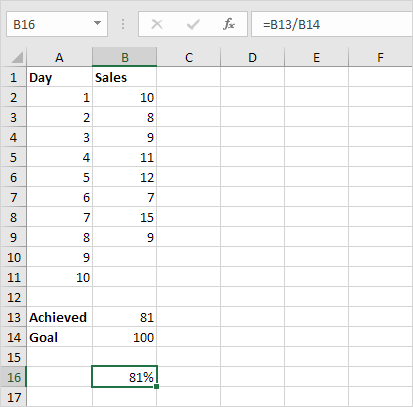
Working with sales record in the table below;

To create a thermometer chart, execute the following steps.

1. Select cell B16.

Note: adjacent cells should be empty.

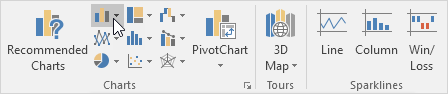
2. On the Insert tab, in the Charts group, click the Column symbol.

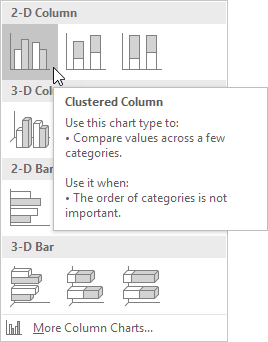
3. Click Clustered Column.
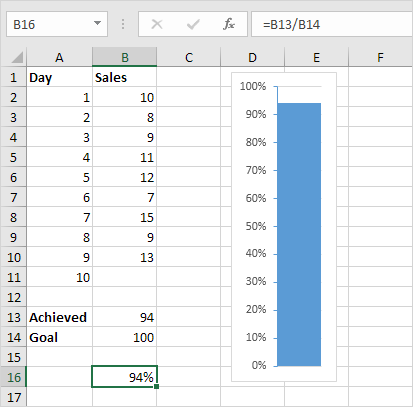
Result:

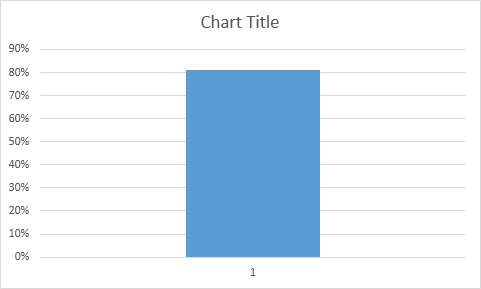
Further customize the chart.

4. Remove the chart tile and the horizontal axis.

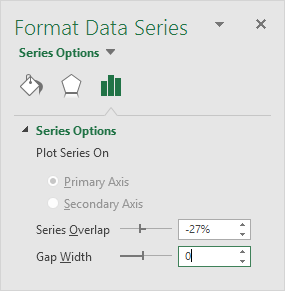
5. Right click the blue bar, click Format Data Series and change the Gap Width to 0%.

6. Change the width of the chart.

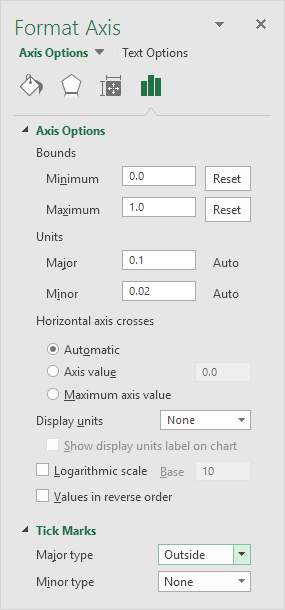
7. Right click the percentages on the chart, click Format Axis, fix the minimum bound to 0, the maximum bound to 1 and set the Major tick mark type to Outside.

Result:

Post navigation

Previous Post:

VLOOKUP without #N/A error in Excel

Next Post:

Manipulating text strings using Left, Mid, Right, Len, Substitute in Excel

Leave a Reply Cancel reply

Your email address will not be published. Required fields are marked *

Learn Basic Excel

Ribbon
Workbook
Worksheets
Format Cells
Find & Select
Sort & Filter
Templates
Print
Share
Protect
Keyboard Shortcuts

Categories

  • Charts
  • Data Analysis
  • Data Validation
  • Excel Functions
    • Cube Functions
    • Database Functions
    • Date and Time Functions
    • Engineering Functions
    • Financial Functions
    • Information Functions
    • Logical Functions
    • Lookup and Reference Functions
    • Math and Trig Functions
    • Statistical Functions
    • Text Functions
    • Web Functions
  • Excel VBA
  • Excel Video Tutorials
  • Formatting
  • Grouping
  • Others

Logical Functions

  • Invoice status with nested if in Excel
  • Complete List of Excel Logical Functions, References and Examples
  • NOT function: Description, Usage, Syntax, Examples and Explanation
  • IF with boolean logic in Excel
  • IF function: Description, Usage, Syntax, Examples and Explanation

Date Time

  • Basic timesheet formula with breaks in Excel
  • Get fiscal year from date in Excel
  • Generate series of dates by weekends in Excel
  • Convert text to date in Excel
  • Get work hours between dates custom schedule in Excel

Grouping

  • How to randomly assign data to groups in Excel
  • Map inputs to arbitrary values in Excel
  • Running count group by n size in Excel
  • Group times into unequal buckets in Excel
  • Group arbitrary text values in Excel

General

  • Creating and Opening an existing file in Excel
  • Find Most Frequently Occurring Word in Excel Worksheet
  • Currency vs Accounting Format in Excel
  • Customize Ribbon In Excel
  • Subtotal by invoice number in Excel
© 2026 xlsoffice . All Right Reserved. | Teal Smiles | Abbreviations And Their Meaning