
Skip to content
Free Excel Tutorials
  • Home
  • Excel For Beginners
  • Excel Intermediate
  • Advanced Excel For Experts

Data Analysis

  • How to Create Gantt Chart in Excel
  • How to conditionally sum numeric data in an Excel table using SUMIFS
  • Number and Text Filters Examples in Excel
  • Conditional Formatting Data bars Examples in Excel
  • Working With Tables in Excel

References

  • How to calculate two-way lookup VLOOKUP in Excel Table
  • Two-column Lookup in Excel
  • CHOOSE function: Description, Usage, Syntax, Examples and Explanation
  • Convert text string to valid reference in Excel using Indirect function
  • How to get last row in mixed data with blanks in Excel

Data Validations

  • Excel Data validation only dates between
  • Excel Data validation number multiple 100
  • Excel Data validation must begin with
  • Excel Data validation date in specific year
  • Prevent invalid data entering in specific cells

How to Sort by Color in Excel

by

Sorting data is an integral part of data analysis. You might want to arrange a list of names in alphabetical order, compile a list of product inventory levels from highest to lowest, or order rows by colors or icons.

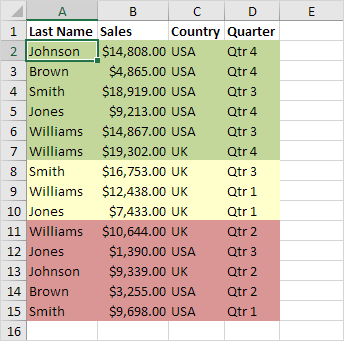
This example teaches you how to sort data by color in Excel.
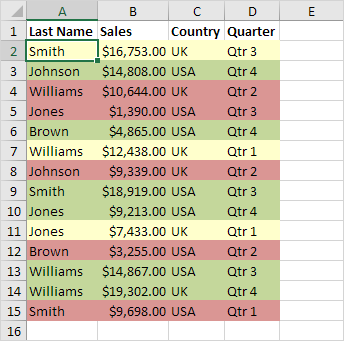
1. Click any single cell inside a data set.

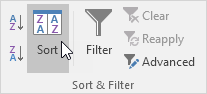
2. On the Data tab, in the Sort & Filter group, click Sort.
The Sort dialog box appears.

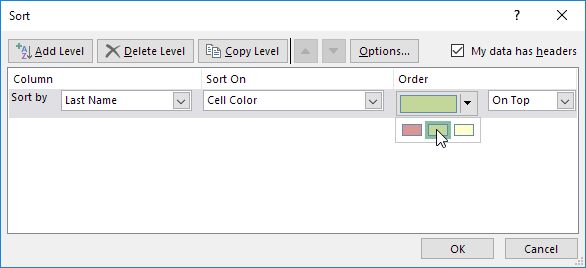
3. Sort by Last Name (or any other column), sort on Cell Color (you can also sort on Font Color and Cell Icon), and select the green color for the first level.
4. Click ‘Copy Level’ two times and select the other colors.

5. Click OK.
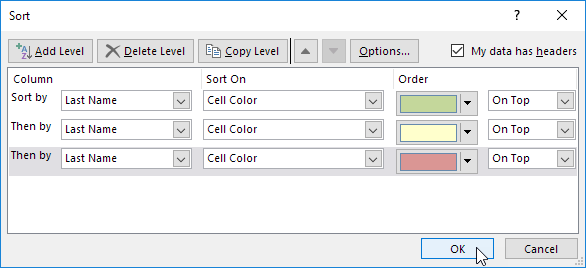
Result.
Post navigation

Previous Post:

COSH function: Description, Usage, Syntax, Examples and Explanation

Next Post:

Excel Data validation require unique number

Leave a Reply Cancel reply

Your email address will not be published. Required fields are marked *

Learn Basic Excel

Ribbon
Workbook
Worksheets
Format Cells
Find & Select
Sort & Filter
Templates
Print
Share
Protect
Keyboard Shortcuts

Categories

  • Charts
  • Data Analysis
  • Data Validation
  • Excel Functions
    • Cube Functions
    • Database Functions
    • Date and Time Functions
    • Engineering Functions
    • Financial Functions
    • Information Functions
    • Logical Functions
    • Lookup and Reference Functions
    • Math and Trig Functions
    • Statistical Functions
    • Text Functions
    • Web Functions
  • Excel VBA
  • Excel Video Tutorials
  • Formatting
  • Grouping
  • Others

Logical Functions

  • IFS function: Description, Usage, Syntax, Examples and Explanation
  • How to use Excel XOR Function
  • Extract multiple matches into separate rows in Excel
  • How to use Excel AND Function
  • Return blank if in Excel

Date Time

  • How to get Holiday Date from Year in Excel
  • DATEDIF function: Description, Usage, Syntax, Examples and Explanation
  • WEEKDAY function: Description, Usage, Syntax, Examples and Explanation
  • Convert Unix time stamp to Excel date
  • How to calculate nth day of week in month in Excel

Grouping

  • Group numbers with VLOOKUP in Excel
  • Calculate conditional mode with criteria in Excel
  • Running count group by n size in Excel
  • Categorize text with keywords in Excel
  • How to randomly assign people to groups in Excel

General

  • How to calculate total from percentage in Excel
  • Lock Cells in a Worksheet Excel
  • How to count total columns in range in Excel
  • Basic text sort formula in Excel
  • Find Most Frequently Occurring Word in Excel Worksheet
© 2026 xlsoffice . All Right Reserved. | Teal Smiles | Abbreviations And Their Meaning