

Skip to content
Free Excel Tutorials
  • Home
  • Excel For Beginners
  • Excel Intermediate
  • Advanced Excel For Experts

Data Analysis

  • How To Sort One Column or Multiple Columns in Excel
  • How To Perform and Interpret Regression Analysis in Excel
  • Randomize/ Shuffle List in Excel
  • How to Create Gantt Chart in Excel
  • Reverse List in Excel

References

  • Basic INDEX MATCH approximate in Excel
  • How to get first column number in range in Excel
  • CHOOSE function: Description, Usage, Syntax, Examples and Explanation
  • Approximate match with multiple criteria in Excel
  • Merge tables with VLOOKUP in Excel

Data Validations

  • Excel Data validation require unique number
  • Excel Data validation must begin with
  • Excel Data validation exists in list
  • Excel Data validation unique values only
  • Excel Data validation with conditional list

Only Find Duplicates in Excel

by

This example teaches you how to find duplicates (or triplicates) in Excel.

Sometimes duplicate data is useful, sometimes it just makes it harder to understand your data.

When you just want to identify but not remove duplicate;

Use conditional formatting to find and highlight duplicate data. That way you can review the duplicates and decide if you want to remove them.

Select the cells you want to check for duplicates.

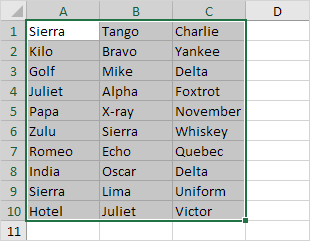
1. Select the range A1:C10.
2. On the Home tab, in the Styles group, click Conditional Formatting.

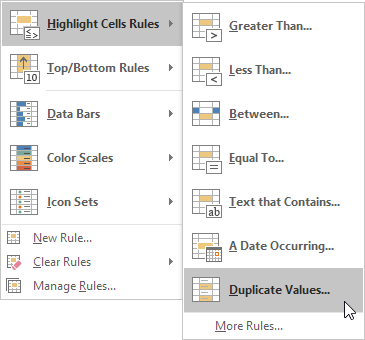
3. Click Highlight Cells Rules, Duplicate Values.
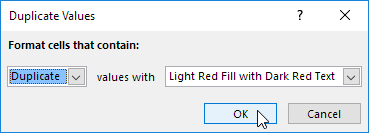
4. Select a formatting style and click OK.
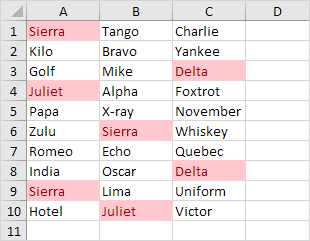
Result. Excel highlights the duplicate names.
Note: select Unique from the first drop-down list to highlight the unique names.

As you can see, Excel highlights duplicates (Juliet, Delta), triplicates (Sierra), quadruplicates (if we have any), etc. Execute the following steps to highlight triplicates only.

5. First, clear the previous conditional formatting rule.

6. Select the range A1:C10.

7. On the Home tab, in the Styles group, click Conditional Formatting.

8. Click New Rule.
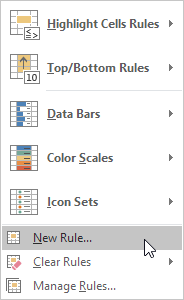
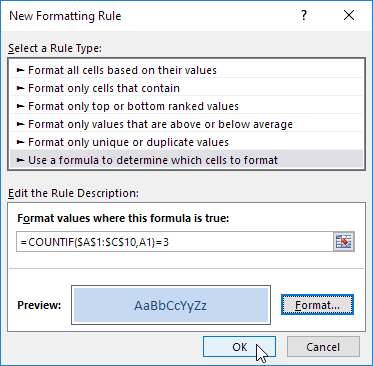
9. Select ‘Use a formula to determine which cells to format’.

10. Enter the formula =COUNTIF($A$1:$C$10,A1)=3

11. Select a formatting style and click OK.
Result. Excel highlights the triplicate names.
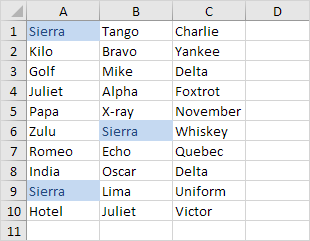
Explanation: =COUNTIF($A$1:$C$10,A1) counts the number of names in the range A1:C10 that are equal to the name in cell A1. If COUNTIF($A$1:$C$10,A1) = 3, Excel formats the cell. Because we selected the range A1:C10 before we clicked on Conditional Formatting, Excel automatically copies the formula to the other cells. Thus, cell A2 contains the formula =COUNTIF($A$1:$C$10,A2)=3, cell A3 =COUNTIF($A$1:$C$10,A3)=3, etc. Notice how we created an absolute reference ($A$1:$C$10) to fix this reference.

Note: you can use any formula you like. For example, use this formula =COUNTIF($A$1:$C$10,A1)>3 to highlight the names that occur more than 3 times.

Post navigation

Previous Post:

TRUE function: Description, Usage, Syntax, Examples and Explanation

Next Post:

Excel Pie Chart

Leave a Reply Cancel reply

Your email address will not be published. Required fields are marked *

Learn Basic Excel

Ribbon
Workbook
Worksheets
Format Cells
Find & Select
Sort & Filter
Templates
Print
Share
Protect
Keyboard Shortcuts

Categories

  • Charts
  • Data Analysis
  • Data Validation
  • Excel Functions
    • Cube Functions
    • Database Functions
    • Date and Time Functions
    • Engineering Functions
    • Financial Functions
    • Information Functions
    • Logical Functions
    • Lookup and Reference Functions
    • Math and Trig Functions
    • Statistical Functions
    • Text Functions
    • Web Functions
  • Excel VBA
  • Excel Video Tutorials
  • Formatting
  • Grouping
  • Others

Logical Functions

  • IF, AND, OR and NOT Functions Examples in Excel
  • How to use IFS function in Excel
  • IF function: Description, Usage, Syntax, Examples and Explanation
  • How to use Excel TRUE Function
  • FALSE function: Description, Usage, Syntax, Examples and Explanation

Date Time

  • Steps to create Dynamic calendar grid in Excel
  • Get days, months, and years between dates in Excel
  • How to calculate most recent day of week in Excel
  • Get project midpoint in Excel
  • How to get workdays between dates in Excel

Grouping

  • Map text to numbers in Excel
  • Running count group by n size in Excel
  • Group numbers at uneven intervals in Excel
  • Group times into 3 hour buckets in Excel
  • Map inputs to arbitrary values in Excel

General

  • How to Insert Cells, Row and Rows in Excel
  • Sum by group in Excel
  • How to increase by percentage in Excel
  • Mark Workbook as Final in Excel
  • How to calculate percent variance in Excel
© 2026 xlsoffice . All Right Reserved. | Teal Smiles | Abbreviations And Their Meaning