Skip to content
Free Excel Tutorials
  • Home
  • Excel For Beginners
  • Excel Intermediate
  • Advanced Excel For Experts

Data Analysis

  • Conditional Formatting Icon Sets Examples in Excel
  • How to Create One and Two Variable Data Tables in Excel
  • Error Bars in Excel
  • How to do a t-Test in Excel?
  • How To Create Pareto Chart in Excel

References

  • How to get address of named range in Excel
  • Offset in Excel
  • How to retrieve first match between two ranges in Excel
  • How to get first row number in range in Excel
  • Extract data with helper column in Excel

Data Validations

  • Excel Data validation unique values only
  • Excel Data validation date in specific year
  • Excel Data validation number multiple 100
  • Excel Data validation date in next 30 days
  • Excel Data validation with conditional list

Highlight every other row in Excel

by

This tutorial shows how to Highlight every other row in Excel using the example below;

Formula

=ISEVEN(ROW())

Explanation

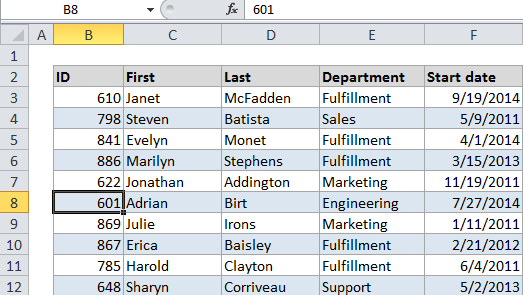
If you want to highlight every other row in a table (sometimes called zebra striping) with conditional formatting you can do so with a simple formula that uses either the ISEVEN or ISODD function. For example, if you want to highlight every other row in the range B3:F102 select the entire range then create a conditional formatting rule that uses this formula:

=ISEVEN(ROW())

How this formula works

When you use a formula to apply conditional formatting, the formula is evaluated for every cell in the selection. In this case, there are no addresses in the formula, so, for every cell in the data, the ROW and ISEVEN functions are run. ROW returns the row number of the cell, and ISEVEN returns TRUE if the row number is even and FALSE if the row number is odd. The rule will trigger on TRUE, so even rows will be shaded.

To shade odd rows, just use ISODD instead:

=ISODD(ROW())

A MOD alternative

If you’re using an older version of Excel (before 2007) you may not have access to ISEVEN and ISODD. In that case, you can use the “classic” formula for shading even or odd rows, which depends on the MOD function:

=MOD(ROW(),2) = 0 // returns true for even rows
=MOD(ROW(),2) = 1 // returns true for odd rows

MOD takes a number and a divisor as arguments, and returns the remainder. The ROW function provides the number, which is divided by 2, so MOD  returns zero when the row is an even number and 1 if not.

Post navigation

Previous Post:

COSH function: Description, Usage, Syntax, Examples and Explanation

Next Post:

Excel Data validation require unique number

Leave a Reply Cancel reply

Your email address will not be published. Required fields are marked *

Learn Basic Excel

Ribbon
Workbook
Worksheets
Format Cells
Find & Select
Sort & Filter
Templates
Print
Share
Protect
Keyboard Shortcuts

Categories

  • Charts
  • Data Analysis
  • Data Validation
  • Excel Functions
    • Cube Functions
    • Database Functions
    • Date and Time Functions
    • Engineering Functions
    • Financial Functions
    • Information Functions
    • Logical Functions
    • Lookup and Reference Functions
    • Math and Trig Functions
    • Statistical Functions
    • Text Functions
    • Web Functions
  • Excel VBA
  • Excel Video Tutorials
  • Formatting
  • Grouping
  • Others

Logical Functions

  • Invoice status with nested if in Excel
  • OR function Examples in Excel
  • Extract multiple matches into separate rows in Excel
  • XOR function: Description, Usage, Syntax, Examples and Explanation
  • FALSE function: Description, Usage, Syntax, Examples and Explanation

Date Time

  • Calculate total hours that fall between two times in Excel
  • Convert Unix time stamp to Excel date
  • How to calculate next anniversary date or birthday in Excel
  • EOMONTH function: Description, Usage, Syntax, Examples and Explanation
  • YEARFRAC function: Description, Usage, Syntax, Examples and Explanation

Grouping

  • How to randomly assign people to groups in Excel
  • Categorize text with keywords in Excel
  • Calculate conditional mode with criteria in Excel
  • How to randomly assign data to groups in Excel
  • Map inputs to arbitrary values in Excel

General

  • How to get original number from percent change in Excel
  • Sum by group in Excel
  • How to create dynamic named range with INDEX in Excel
  • Customize Ribbon In Excel
  • Currency vs Accounting Format in Excel
© 2026 xlsoffice . All Right Reserved. | Teal Smiles | Abbreviations And Their Meaning