Skip to content
Free Excel Tutorials
  • Home
  • Excel For Beginners
  • Excel Intermediate
  • Advanced Excel For Experts

Data Analysis

  • How to do a t-Test in Excel?
  • Conditional Formatting Rules in Excel
  • How to Create Column Chart in Excel
  • Conditional Formatting Icon Sets Examples in Excel
  • How to calculate current stock or inventory in Excel

References

  • How to calculate two-way lookup VLOOKUP in Excel Table
  • How to get first column number in range in Excel
  • Vlookup Examples in Excel
  • LOOKUP function: Description, Usage, Syntax, Examples and Explanation
  • How to create dynamic named range with OFFSET in Excel

Data Validations

  • Excel Data validation number multiple 100
  • Excel Data validation unique values only
  • Excel Data validation exists in list
  • Excel Data validation specific characters only
  • Excel Data validation must begin with

NORM.S.DIST function: Description, Usage, Syntax, Examples and Explanation

by

What is NORM.S.DIST function in Excel?

NORM.S.DIST function is one of Statistical functions in Microsoft Excel that returns the standard normal distribution (has a mean of zero and a standard deviation of one).
Use this function in place of a table of standard normal curve areas.

Syntax of NORM.S.DIST function – Standard Normal Distribution

NORM.S.DIST(z,cumulative)

The NORM.S.DIST function syntax has the following arguments:

  • Z: The value for which you want the distribution.
  • Cumulative: Cumulative is a logical value that determines the form of the function. If cumulative is TRUE, NORMS.DIST returns the cumulative distribution function; if FALSE, it returns the probability mass function.

NORM.S.DIST formula explanation

  • If z is nonnumeric, NORM.S.DIST returns the #VALUE! error value.
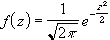
  • The equation for the standard normal density function is:Equation

Example of NORM.S.DIST function

Steps to follow:

1. Open a new Excel worksheet.

2. Copy data in the following table below and paste it in cell A1

Note: For formulas to show results, select them, press F2 key on your keyboard and then press Enter.

You can adjust the column widths to see all the data, if need be.

Formula Description Result
=NORM.S.DIST(1.333333,TRUE) Normal cumulative distribution function at 1.333333 0.908788726
=NORM.S.DIST(1.333333,FALSE) Normal probability distribution function at 1.333333 0.164010148

Post navigation

Previous Post:

CUBEVALUE function: Description, Usage, Syntax, Examples and Explanation

Next Post:

CLEAN function: Description, Usage, Syntax, Examples and Explanation

Leave a Reply Cancel reply

Your email address will not be published. Required fields are marked *

Learn Basic Excel

Ribbon
Workbook
Worksheets
Format Cells
Find & Select
Sort & Filter
Templates
Print
Share
Protect
Keyboard Shortcuts

Categories

  • Charts
  • Data Analysis
  • Data Validation
  • Excel Functions
    • Cube Functions
    • Database Functions
    • Date and Time Functions
    • Engineering Functions
    • Financial Functions
    • Information Functions
    • Logical Functions
    • Lookup and Reference Functions
    • Math and Trig Functions
    • Statistical Functions
    • Text Functions
    • Web Functions
  • Excel VBA
  • Excel Video Tutorials
  • Formatting
  • Grouping
  • Others

Logical Functions

  • How to return blank in place of #DIV/0! error in Excel
  • How to use Excel XOR Function
  • NOT function: Description, Usage, Syntax, Examples and Explanation
  • How to use Excel AND Function
  • How to use Excel FALSE Function

Date Time

  • Basic Overtime Calculation Formula in Excel
  • Create date range from two dates in Excel
  • Calculate days remaining in Excel
  • Convert Excel time to decimal minutes
  • How to calculate nth day of week in month in Excel

Grouping

  • Group times into 3 hour buckets in Excel
  • If cell contains one of many things in Excel
  • Group numbers at uneven intervals in Excel
  • Group times into unequal buckets in Excel
  • How to randomly assign people to groups in Excel

General

  • Subtotal by color in Excel
  • Customize Ribbon In Excel
  • How to calculate percent variance in Excel
  • Flash Fill in Excel
  • How to test a range for numbers in Excel
© 2025 xlsoffice . All Right Reserved. | Teal Smiles | Abbreviations And Their Meaning