Skip to content
Free Excel Tutorials
  • Home
  • Excel For Beginners
  • Excel Intermediate
  • Advanced Excel For Experts

Data Analysis

  • Error Bars in Excel
  • Subtotal function in Excel
  • Working With Tables in Excel
  • Reverse List in Excel
  • How to create Gauge Chart in Excel

References

  • How to get last row in text data in Excel
  • How to get first column number in range in Excel
  • How to use Excel MATCH Function
  • Two-column Lookup in Excel
  • Find closest match in Excel

Data Validations

  • Excel Data validation number multiple 100
  • Excel Data validation date in specific year
  • Excel Data validation exists in list
  • Excel Data validation no punctuation
  • Data validation must not exist in list

Excel Pie Chart

by

Pie charts are used to display the contribution of each value (slice) to a total (pie). Pie charts always use one data series.

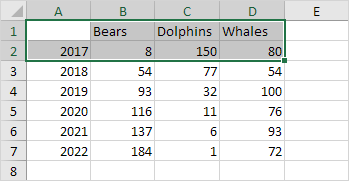
To create a pie chart of the 2017 data series, execute the following steps.

1. Select the range A1:D2.

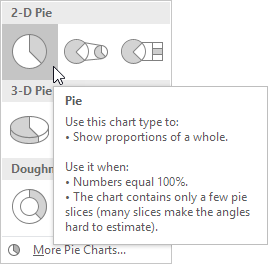
2. On the Insert tab, in the Charts group, click the Pie symbol.

3. Click Pie.

Result:

4. Click on the pie to select the whole pie. Click on a slice to drag it away from the center.

Result:

Note: only if you have numeric labels, empty cell A1 before you create the pie chart. By doing this, Excel does not recognize the numbers in column A as a data series and automatically creates the correct chart. After creating the chart, you can enter the text Year into cell A1 if you like.

Post navigation

Previous Post:

MDETERM function: Description, Usage, Syntax, Examples and Explanation

Next Post:

Sales Calculator in Excel

Leave a Reply Cancel reply

Your email address will not be published. Required fields are marked *

Learn Basic Excel

Ribbon
Workbook
Worksheets
Format Cells
Find & Select
Sort & Filter
Templates
Print
Share
Protect
Keyboard Shortcuts

Categories

  • Charts
  • Data Analysis
  • Data Validation
  • Excel Functions
    • Cube Functions
    • Database Functions
    • Date and Time Functions
    • Engineering Functions
    • Financial Functions
    • Information Functions
    • Logical Functions
    • Lookup and Reference Functions
    • Math and Trig Functions
    • Statistical Functions
    • Text Functions
    • Web Functions
  • Excel VBA
  • Excel Video Tutorials
  • Formatting
  • Grouping
  • Others

Logical Functions

  • Complete List of Excel Logical Functions, References and Examples
  • How to use Excel TRUE Function
  • OR function: Description, Usage, Syntax, Examples and Explanation
  • IF with boolean logic in Excel
  • How to use Excel OR Function

Date Time

  • How to calculate future date say 6 months ahead in Excel
  • EOMONTH function: Description, Usage, Syntax, Examples and Explanation
  • Convert text timestamp into time in Excel
  • Convert date to month and year in Excel
  • Add workdays to date custom weekends in Excel

Grouping

  • Categorize text with keywords in Excel
  • Map inputs to arbitrary values in Excel
  • Map text to numbers in Excel
  • Running count group by n size in Excel
  • Group times into 3 hour buckets in Excel

General

  • Subtotal invoices by age in Excel
  • Excel Operators
  • Transpose: Switch ‘Rows to Columns’ or ‘Columns to Rows’ in Excel
  • Index and match on multiple columns in Excel
  • Find, Select, Replace and Go To Special in Excel
© 2025 xlsoffice . All Right Reserved. | Teal Smiles | Abbreviations And Their Meaning