Skip to content
Free Excel Tutorials
  • Home
  • Excel For Beginners
  • Excel Intermediate
  • Advanced Excel For Experts

Data Analysis

  • Calculate Conditional Percentile ‘IF’ in table in Excel
  • How to combine 2 or more chart types in a single chart in Excel
  • How to Create Column Chart in Excel
  • How To Sort One Column or Multiple Columns in Excel
  • How To Create Frequency Distribution in Excel

References

  • How to get last column number in range in Excel
  • Extract all partial matches in Excel
  • Count rows that contain specific values in Excel
  • MATCH function: Description, Usage, Syntax, Examples and Explanation
  • LOOKUP function: Description, Usage, Syntax, Examples and Explanation

Data Validations

  • How To Create Drop-down List in Excel
  • Excel Data validation allow weekday only
  • Excel Data validation no punctuation
  • Excel Data validation whole percentage only
  • Excel Data validation date in next 30 days

Conflicting Multiple Conditional Formatting Rules in Excel

by

A higher rule always wins when working with  multiple conditional formatting rules in Excel . This example illustrates two different results.

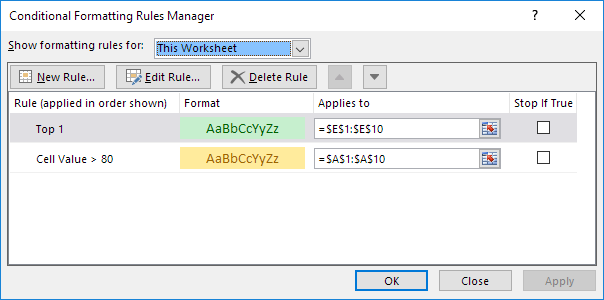
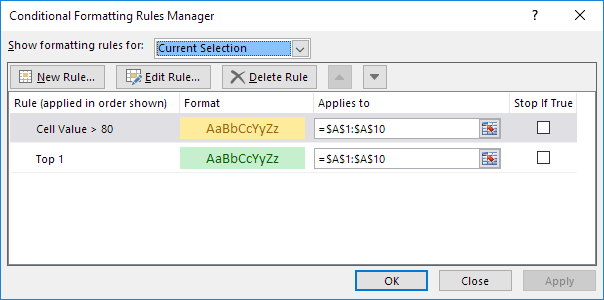
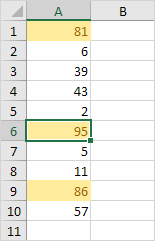
1. The value 95 is higher than 80 but is also the highest value (Top 1). The formats (yellow fill vs green fill and yellow text color vs green text color) conflict. A higher rule always wins. As a result, the value 95 is colored yellow.


Result:

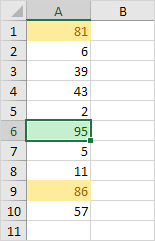
2. Move the second rule up. The value 95 is the highest value (Top 1) but is also higher than 80. The formats (green fill vs yellow fill and green text color vs yellow text color) conflict. A higher rule always wins. As a result, the value 95 is colored green.
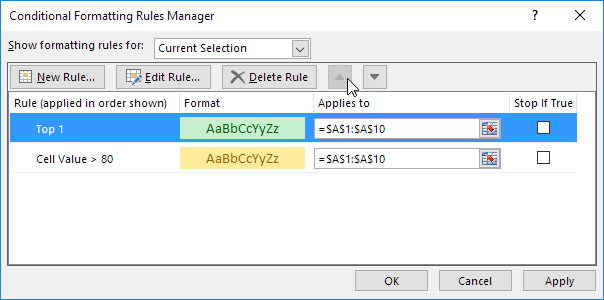
Result:

Note: only use the Stop If True check boxes for backwards compatibility with earlier versions of Microsoft Excel.

Post navigation

Previous Post:

VLOOKUP without #N/A error in Excel

Next Post:

Manipulating text strings using Left, Mid, Right, Len, Substitute in Excel

Leave a Reply Cancel reply

Your email address will not be published. Required fields are marked *

Learn Basic Excel

Ribbon
Workbook
Worksheets
Format Cells
Find & Select
Sort & Filter
Templates
Print
Share
Protect
Keyboard Shortcuts

Categories

  • Charts
  • Data Analysis
  • Data Validation
  • Excel Functions
    • Cube Functions
    • Database Functions
    • Date and Time Functions
    • Engineering Functions
    • Financial Functions
    • Information Functions
    • Logical Functions
    • Lookup and Reference Functions
    • Math and Trig Functions
    • Statistical Functions
    • Text Functions
    • Web Functions
  • Excel VBA
  • Excel Video Tutorials
  • Formatting
  • Grouping
  • Others

Logical Functions

  • How to use Excel AND Function
  • Check multiple cells are equal in Excel
  • How to use Excel FALSE Function
  • How to use Excel NOT Function
  • How to use IFS function in Excel

Date Time

  • Calculate time difference in hours as decimal value in Excel
  • How to calculate Quarter of Date in Excel
  • Add workdays no weekends in Excel
  • Series of dates by day
  • How to get Weekdays, Working days between Two Dates in Excel

Grouping

  • Map text to numbers in Excel
  • Running count group by n size in Excel
  • Group times into 3 hour buckets in Excel
  • Group arbitrary text values in Excel
  • Group numbers at uneven intervals in Excel

General

  • Hide and Unhide Columns or Rows in Excel
  • How to calculate percent of students absent in Excel
  • How to calculate decrease by percentage in Excel
  • Using Existing Templates in Excel
  • Convert column number to letter in Excel
© 2026 xlsoffice . All Right Reserved. | Teal Smiles | Abbreviations And Their Meaning