Skip to content
Free Excel Tutorials
  • Home
  • Excel For Beginners
  • Excel Intermediate
  • Advanced Excel For Experts

Data Analysis

  • How to count table columns in Excel
  • Remove Duplicates Example in Excel
  • What-If Analysis: Scenarios and Goal Seek in Excel
  • Move chart to a separate worksheet in Excel
  • Managing Conditional Formatting Rules in Excel

References

  • Find closest match in Excel
  • How to use Excel COLUMN Function
  • Two-column Lookup in Excel
  • Extract all partial matches in Excel
  • How to get address of named range in Excel

Data Validations

  • Excel Data validation no punctuation
  • Excel Data validation number multiple 100
  • Excel Data validation don’t exceed total
  • Prevent invalid data entering in specific cells
  • Data validation must not exist in list

How to create a Histogram in Excel

by

This example teaches you how to create a histogram in Excel.

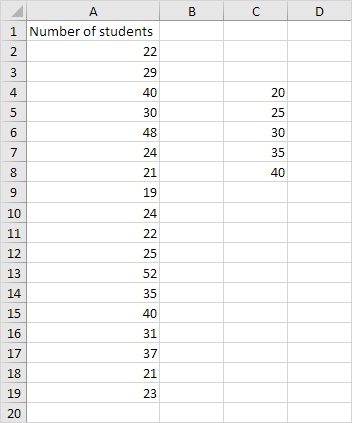
1. First, enter the bin numbers (upper levels) in the range C4:C8.

bin number How to create a Histogram in Excel

 2. On the Data tab, in the Analysis group, click Data Analysis.
click data analysis How to create a Histogram in Excel

Note: can’t find the Data Analysis button? Click here to load the Analysis ToolPak add-in.

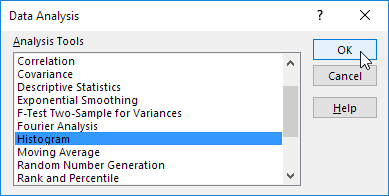
3. Select Histogram and click OK.

select histogram How to create a Histogram in Excel

4. Select the range A2:A19.

5. Click in the Bin Range box and select the range C4:C8.

6. Click the Output Range option button, click in the Output Range box and select cell F3.

7. Check Chart Output.
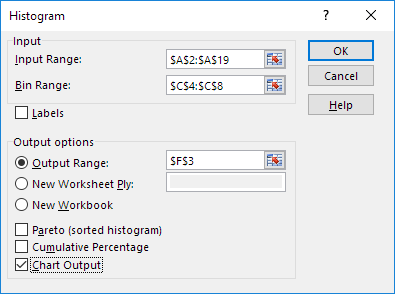
histogram parameter in How to create a Histogram in Excel

8. Click OK.

histogram result in How to create a Histogram in Excel
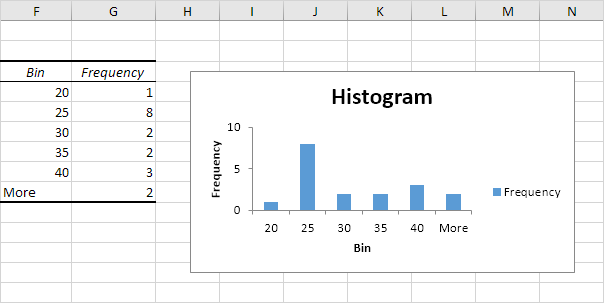
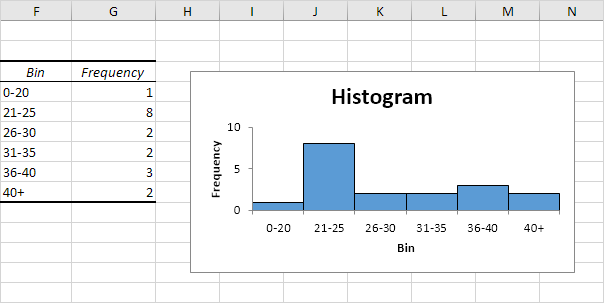
9. Click the legend on the right side and press Delete.

10. Properly label your bins.

11. To remove the space between the bars, right click a bar, click Format Data Series and change the Gap Width to 0%.

12. To add borders, right click a bar, click Format Data Series, click the Fill & Line icon, click Border and select a color.

Result:

histogram final result How to create a Histogram in Excel

Post navigation

Previous Post:

TRUE function: Description, Usage, Syntax, Examples and Explanation

Next Post:

Excel Pie Chart

Leave a Reply Cancel reply

Your email address will not be published. Required fields are marked *

Learn Basic Excel

Ribbon
Workbook
Worksheets
Format Cells
Find & Select
Sort & Filter
Templates
Print
Share
Protect
Keyboard Shortcuts

Categories

  • Charts
  • Data Analysis
  • Data Validation
  • Excel Functions
    • Cube Functions
    • Database Functions
    • Date and Time Functions
    • Engineering Functions
    • Financial Functions
    • Information Functions
    • Logical Functions
    • Lookup and Reference Functions
    • Math and Trig Functions
    • Statistical Functions
    • Text Functions
    • Web Functions
  • Excel VBA
  • Excel Video Tutorials
  • Formatting
  • Grouping
  • Others

Logical Functions

  • How to use Excel AND Function
  • IFS function: Description, Usage, Syntax, Examples and Explanation
  • NOT function: Description, Usage, Syntax, Examples and Explanation
  • IF, AND, OR and NOT Functions Examples in Excel
  • OR function Examples in Excel

Date Time

  • Roll back weekday to Friday base on a particular date in Excel
  • Convert Excel time to decimal hours in Excel
  • Get first day of previous month in Excel
  • DAYS360 function: Description, Usage, Syntax, Examples and Explanation
  • Get last working day in month in Excel

Grouping

  • Group numbers with VLOOKUP in Excel
  • Running count group by n size in Excel
  • Group arbitrary text values in Excel
  • Calculate conditional mode with criteria in Excel
  • How to randomly assign data to groups in Excel

General

  • 3D SUMIF for multiple worksheets in Excel
  • How to fill cell ranges with random number from fixed set of options in Excel
  • Automatically fill series of cells in Excel using AutoFill
  • How to calculate percent variance in Excel
  • How to create dynamic named range with INDEX in Excel
© 2026 xlsoffice . All Right Reserved. | Teal Smiles | Abbreviations And Their Meaning