Skip to content
Free Excel Tutorials
  • Home
  • Excel For Beginners
  • Excel Intermediate
  • Advanced Excel For Experts

Data Analysis

  • Conditional Formatting New Rule with Formulas in Excel
  • How to count table columns in Excel
  • Excel Frequency Function Example
  • How to add Trendline to a chart in Excel
  • Conflicting Multiple Conditional Formatting Rules in Excel

References

  • Excel Advanced Lookup using Index and Match Functions
  • Extract data with helper column in Excel
  • Basic INDEX MATCH approximate in Excel
  • How to use Excel ROWS Function
  • VLOOKUP function: Description, Usage, Syntax, Examples and Explanation

Data Validations

  • Excel Data validation allow weekday only
  • Data validation must not exist in list
  • Excel Data validation exists in list
  • How To Create Drop-down List in Excel
  • Excel Data validation must begin with

How to calculate percentage of total in Excel

by

To calculate percent of a total (i.e. calculate a percent distribution), you can use a formula that simply divides an amount by the total.

Formula

=amount/total

Explanation

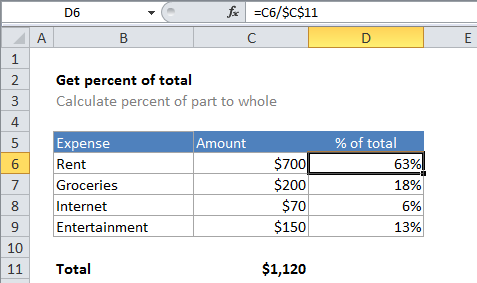
In the example shown, the formula in D6 is:

=C6/$C$11

Note: the result is formatted with Percentage number format to show 25%, 10%, etc.

How the formula works

In the example, D6 contains the formula below, copied down:

=C6/$C$11

In cell D6, the result of the calculation is .625. The Percentage number format is applied to cell D6, with 2 decimal places, so Excel displays .625 as 63%.

The reference to C11 is absolute (i.e. $C$11) so that it won’t change when the formula is copied down column D. This means that each value in column C will be divided by the same total in C11.

Percentage vs number

When you want to display a percentage in Excel, use the Percentage number format, which will automatically display a decimal value as a percentage. If you want a simple number instead without a percent sign (i.e. 75, 85, 100, etc.) you can multiply by 100:

=(C6/$C$11)*100

Post navigation

Previous Post:

DECIMAL function: Description, Usage, Syntax, Examples and Explanation

Next Post:

AVERAGE function: Description, Usage, Syntax, Examples and Explanation

Leave a Reply Cancel reply

Your email address will not be published. Required fields are marked *

Learn Basic Excel

Ribbon
Workbook
Worksheets
Format Cells
Find & Select
Sort & Filter
Templates
Print
Share
Protect
Keyboard Shortcuts

Categories

  • Charts
  • Data Analysis
  • Data Validation
  • Excel Functions
    • Cube Functions
    • Database Functions
    • Date and Time Functions
    • Engineering Functions
    • Financial Functions
    • Information Functions
    • Logical Functions
    • Lookup and Reference Functions
    • Math and Trig Functions
    • Statistical Functions
    • Text Functions
    • Web Functions
  • Excel VBA
  • Excel Video Tutorials
  • Formatting
  • Grouping
  • Others

Logical Functions

  • SWITCH function: Description, Usage, Syntax, Examples and Explanation
  • Return blank if in Excel
  • How to use Excel TRUE Function
  • TRUE function: Description, Usage, Syntax, Examples and Explanation
  • How to use Excel AND Function

Date Time

  • How to calculate next scheduled event in Excel
  • Display Days in month in Excel
  • Convert time to time zone in Excel
  • Display Date is same month in Excel
  • Get fiscal year from date in Excel

Grouping

  • Map inputs to arbitrary values in Excel
  • Group arbitrary text values in Excel
  • Group times into 3 hour buckets in Excel
  • Calculate conditional mode with criteria in Excel
  • Group numbers at uneven intervals in Excel

General

  • Hide and Unhide Columns or Rows in Excel
  • Print Excel Sheet In Landscape Or Portrait
  • How to calculate project complete percentage in Excel
  • Check if multiple cells have same value in Excel
  • How to count total columns in range in Excel
© 2025 xlsoffice . All Right Reserved. | Teal Smiles | Abbreviations And Their Meaning