Skip to content
Free Excel Tutorials
  • Home
  • Excel For Beginners
  • Excel Intermediate
  • Advanced Excel For Experts

Data Analysis

  • How To Insert and Customize Sparklines in Excel
  • How to Create Column Chart in Excel
  • How to Sort by Color in Excel
  • Calculate Conditional Percentile ‘IF’ in table in Excel
  • Conditional Formatting New Rule with Formulas in Excel

References

  • How to retrieve first match between two ranges in Excel
  • How to create dynamic named range with OFFSET in Excel
  • How to use Excel LOOKUP Function
  • MATCH function: Description, Usage, Syntax, Examples and Explanation
  • To count total rows in a range in Excel

Data Validations

  • Data validation must not exist in list
  • Excel Data validation date in specific year
  • How To Create Drop-down List in Excel
  • Excel Data validation must not contain
  • Excel Data validation whole percentage only

Working With Tables in Excel

by

Tables allow you to analyze your data in Excel quickly and easily.

Learn how to insert, sort and filter a table, and how to display a total row at the end of a table.

Navigation: Insert Tab → Tables Group – Table

Insert a Table

To insert a table, execute the following steps.

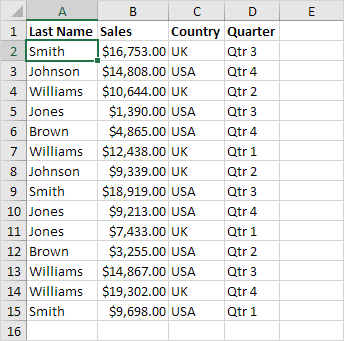
1. Click any single cell inside the data set.

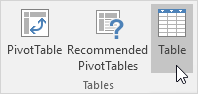
2. On the Insert tab, in the Tables group, click Table.

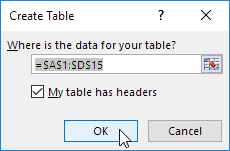
3. Excel automatically selects the data for you. Check ‘My table has headers’ and click on OK.

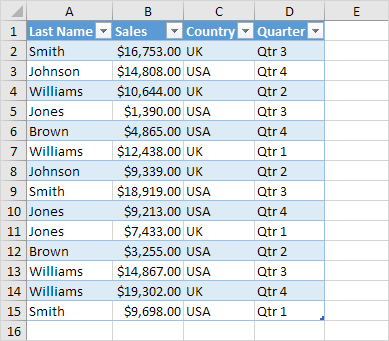
Result. Excel creates a nicely formatted table for you. This may still seem like a normal data range to you but many powerful features are now just a click of a button away.

Sort a Table

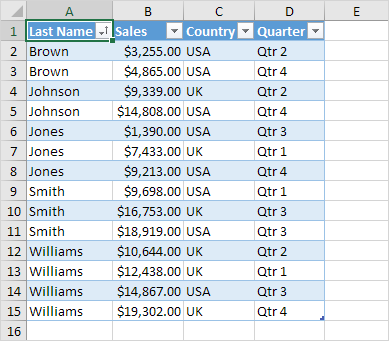
To sort by Last Name first and Sales second, execute the following steps.

1. Click the arrow next to Sales and click Sort Smallest to Largest.

2. Click the arrow next to Last Name and click Sort A to Z.

Result.

Filter a Table

To filter a table, execute the following steps.

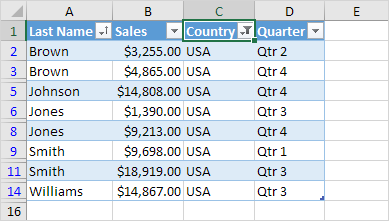
1. Click the arrow next to Country and only check USA.

Result.

Total Row

To display a total row at the end of the table, execute the following steps.

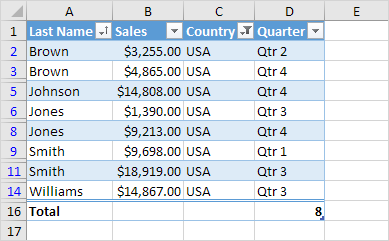
1. First, select a cell inside the table. Next, on the Design tab, in the Table Style Options group, check Total Row.

Result.

2. Click any cell in the last row to calculate the Total (Average, Count, Max, Min, Sum etc.) of a column. For example, calculate the sum of the Sales column.

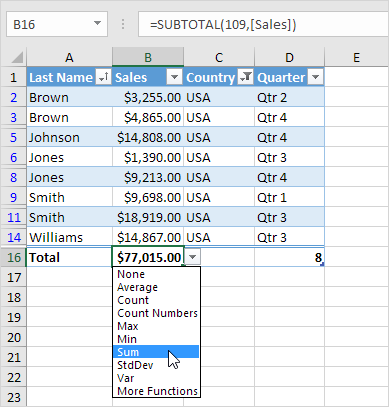
Note: in the formula bar see how Excel uses the SUBTOTAL function to calculate the sum. 109 is the argument for Sum if you use the SUBTOTAL function. Excel uses this function (and not the standard SUM function) to correctly calculate table totals of filtered tables.

Also, Excel tables should not be confused with the data tables (data table: A range of cells that shows the results of substituting different values in one or more formulas. There are two types of data tables: one-input tables and two-input tables.) that are part of a suite of what-if analysis commands.


Post navigation

Previous Post:

TRUE function: Description, Usage, Syntax, Examples and Explanation

Next Post:

Excel Pie Chart

Leave a Reply Cancel reply

Your email address will not be published. Required fields are marked *

Learn Basic Excel

Ribbon
Workbook
Worksheets
Format Cells
Find & Select
Sort & Filter
Templates
Print
Share
Protect
Keyboard Shortcuts

Categories

  • Charts
  • Data Analysis
  • Data Validation
  • Excel Functions
    • Cube Functions
    • Database Functions
    • Date and Time Functions
    • Engineering Functions
    • Financial Functions
    • Information Functions
    • Logical Functions
    • Lookup and Reference Functions
    • Math and Trig Functions
    • Statistical Functions
    • Text Functions
    • Web Functions
  • Excel VBA
  • Excel Video Tutorials
  • Formatting
  • Grouping
  • Others

Logical Functions

  • OR function: Description, Usage, Syntax, Examples and Explanation
  • How to use IFS function in Excel
  • How to use Excel OR Function
  • How to use Excel XOR Function
  • OR function Examples in Excel

Date Time

  • Get days, months, and years between dates in Excel
  • Get days before a date in Excel
  • Calculate retirement date in Excel
  • Count day of week between dates in Excel
  • HOUR function: Description, Usage, Syntax, Examples and Explanation

Grouping

  • Calculate conditional mode with criteria in Excel
  • Categorize text with keywords in Excel
  • Group times into unequal buckets in Excel
  • Group times into 3 hour buckets in Excel
  • How to randomly assign data to groups in Excel

General

  • Freeze and Unfreeze Panes in Excel
  • Automatically fill series of cells in Excel using AutoFill
  • Convert column letter to number in Excel
  • Find, Trace and Correct Errors in Excel Formulas using ‘Formula Auditing’
  • Customize Ribbon In Excel
© 2025 xlsoffice . All Right Reserved. | Teal Smiles | Abbreviations And Their Meaning