
What-If Analysis: Scenarios and Goal Seek in Excel
What-If Analysis in Excel allows you to try out different values (scenarios) for formulas. The following example helps you master what-if analysis quickly and easily.
Create Different Scenarios, Scenario Summary and Goal Seek.
Navigation: Data Tab → Data Tools Group → What-If Analysis
See Examples below:
Assume you own a book store and have 100 books in storage. You sell a certain % for the highest price of $50 and a certain % for the lower price of $20.
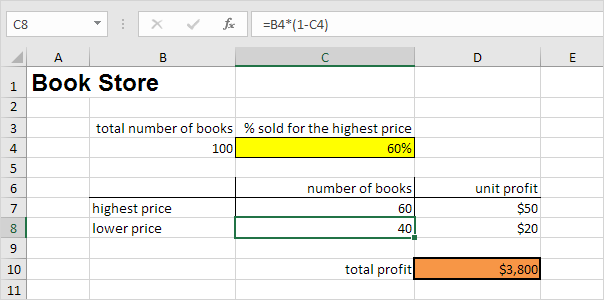
If you sell 60% for the highest price, cell D10 calculates a total profit of 60 * $50 + 40 * $20 = $3800.
Create Different Scenarios
But what if you sell 70% for the highest price? And what if you sell 80% for the highest price? Or 90%, or even 100%? Each different percentage is a different scenario. You can use the Scenario Manager to create these scenarios.
Note: You can simply type in a different percentage into cell C4 to see the corresponding result of a scenario in cell D10. However, what-if analysis enables you to easily compare the results of different scenarios. Read on.
1. On the Data tab, in the Forecast group, click What-If Analysis.

2. Click Scenario Manager.

The Scenario Manager dialog box appears.
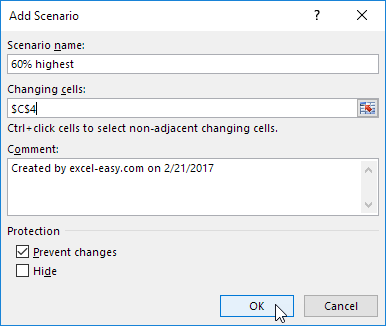
3. Add a scenario by clicking on Add.

4. Type a name (60% highest), select cell C4 (% sold for the highest price) for the Changing cells and click on OK.
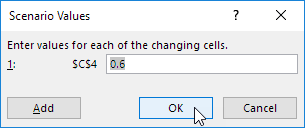
5. Enter the corresponding value 0.6 and click on OK again.
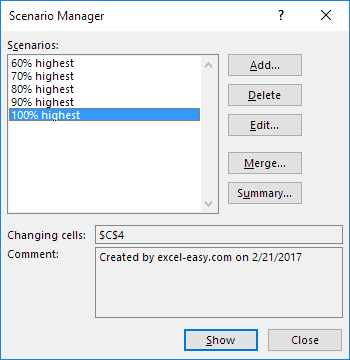
6. Next, add 4 other scenarios (70%, 80%, 90% and 100%).
Finally, your Scenario Manager should be consistent with the picture below:
Note: to see the result of a scenario, select the scenario and click on the Show button. Excel will change the value of cell C4 accordingly for you to see the corresponding result on the sheet.
Scenario Summary
To easily compare the results of these scenarios, execute the following steps.
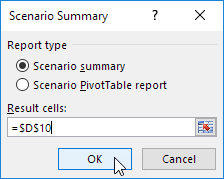
1. Click the Summary button in the Scenario Manager.
2. Next, select cell D10 (total profit) for the result cell and click on OK.
Result:
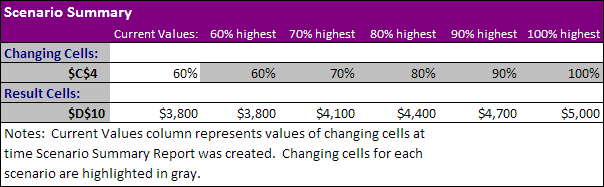
Conclusion: if you sell 70% for the highest price, you obtain a total profit of $4100, if you sell 80% for the highest price, you obtain a total profit of $4400, etc. That’s how easy what-if analysis in Excel can be.
Goal Seek
What if you want to know how many books you need to sell for the highest price, to obtain a total profit of exactly $4700? You can use Excel’s Goal Seek feature to find the answer.
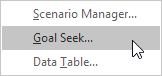
1. On the Data tab, in the Forecast group, click What-If Analysis.
2. Click Goal Seek.
The Goal Seek dialog box appears.
3. Select cell D10.
4. Click in the ‘To value’ box and type 4700.
5. Click in the ‘By changing cell’ box and select cell C4.
6. Click OK.
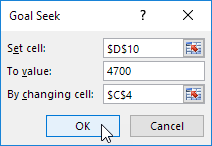
Result. You need to sell 90% of the books for the highest price to obtain a total profit of exactly $4700.
