Skip to content
Free Excel Tutorials
  • Home
  • Excel For Beginners
  • Excel Intermediate
  • Advanced Excel For Experts

Data Analysis

  • Add Outline to Data in Excel
  • Understanding Pivot Tables in Excel
  • Conditional Formatting Color Scales Examples in Excel
  • Conditional Formatting Rules in Excel
  • How to create Checklist in Excel

References

  • Complete List of Excel Lookup and Reference Functions, References and Examples
  • How to use Excel FORMULATEXT function
  • How to get address of last cell in range in Excel
  • LOOKUP function: Description, Usage, Syntax, Examples and Explanation
  • How to use Excel ROWS Function

Data Validations

  • Excel Data validation require unique number
  • How To Create Drop-down List in Excel
  • Excel Data validation must begin with
  • Excel Data validation no punctuation
  • Excel Data validation must contain specific text

Floating Point Errors in Excel

by

Floating point numbers are numbers that follow after a decimal point.

Excel stores and calculates floating point numbers.

On the other hand, excel cannot store numbers with very large floating points, so for the function to work correctly, the floating point numbers will need to be rounded to 5 decimal places. i.e The result of a formula is a very close approximation.

Worked Example:   Subtotal function in Excel

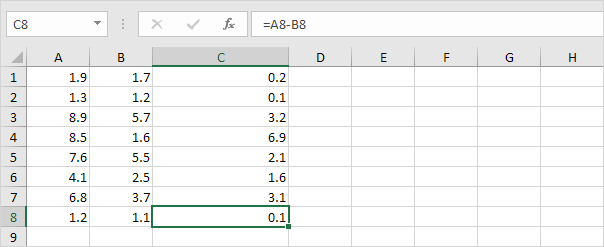
1. For example, take a look at the formulas below. At first glance, everything looks alright.

Worked Example:   Calculating Percentages in Excel

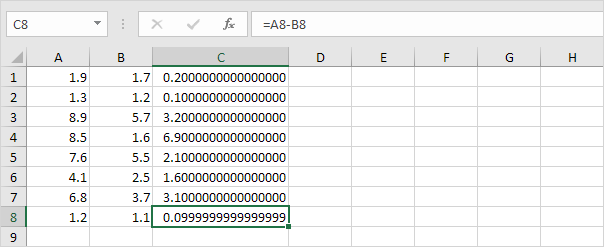
2. However, if we show 16 decimal places, we can see that one result is a very close approximation.

You don’t have to worry about floating point errors. They are rare.

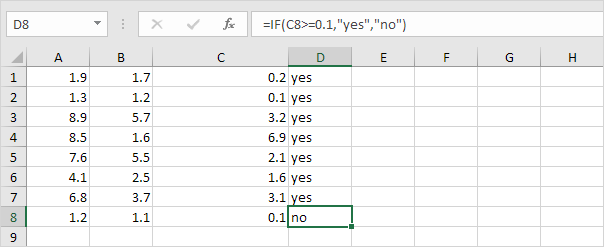
3. Even if your worksheet contains a floating point error, in most cases, this causes no problems. However, if you compare the value in cell C8 with another value, the following problem can occur.

Worked Example:   How to get amount with percentage in Excel

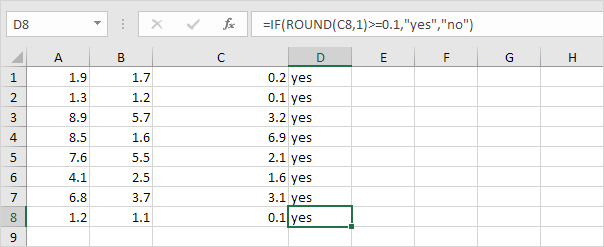
4. Use the ROUND function to fix this.

Post navigation

Previous Post:

How to Create Area Chart in Excel

Next Post:

Excel Line Chart

Leave a Reply Cancel reply

Your email address will not be published. Required fields are marked *

Learn Basic Excel

Ribbon
Workbook
Worksheets
Format Cells
Find & Select
Sort & Filter
Templates
Print
Share
Protect
Keyboard Shortcuts

Categories

  • Charts
  • Data Analysis
  • Data Validation
  • Excel Functions
    • Cube Functions
    • Database Functions
    • Date and Time Functions
    • Engineering Functions
    • Financial Functions
    • Information Functions
    • Logical Functions
    • Lookup and Reference Functions
    • Math and Trig Functions
    • Statistical Functions
    • Text Functions
    • Web Functions
  • Excel VBA
  • Excel Video Tutorials
  • Formatting
  • Grouping
  • Others

Logical Functions

  • AND function: Description, Usage, Syntax, Examples and Explanation
  • IFNA function: Description, Usage, Syntax, Examples and Explanation
  • Excel If, Nested If, And/Or Criteria Examples
  • SWITCH function example in Excel
  • FALSE function: Description, Usage, Syntax, Examples and Explanation

Date Time

  • Steps to create Dynamic calendar grid in Excel
  • How to calculate working days left in month in Excel
  • Display Days in month in Excel
  • Add workdays to date custom weekends in Excel
  • Extract date from a date and time in Excel

Grouping

  • Calculate conditional mode with criteria in Excel
  • Group times into unequal buckets in Excel
  • Group times into 3 hour buckets in Excel
  • Running count group by n size in Excel
  • If cell contains one of many things in Excel

General

  • How to get original number from percent change in Excel
  • Subtotal by color in Excel
  • Excel Operators
  • How to Insert Cells, Row and Rows in Excel
  • Flash Fill in Excel
© 2023 xlsoffice . All Right Reserved. | Teal Smiles | Abbreviations And Their Meaning