Skip to content
Free Excel Tutorials
  • Home
  • Excel For Beginners
  • Excel Intermediate
  • Advanced Excel For Experts

Data Analysis

  • How to Sort by Color in Excel
  • How To Compare Two Lists in Excel
  • How To Sort One Column or Multiple Columns in Excel
  • How to Create One and Two Variable Data Tables in Excel
  • How to Create Gantt Chart in Excel

References

  • Get nth match with INDEX / MATCH in Excel
  • How to retrieve first match between two ranges in Excel
  • Approximate match with multiple criteria in Excel
  • LOOKUP function: Description, Usage, Syntax, Examples and Explanation
  • How to use Excel OFFSET function

Data Validations

  • Excel Data validation date in next 30 days
  • Excel Data validation with conditional list
  • Excel Data validation must begin with
  • Excel Data validation date in specific year
  • Excel Data validation no punctuation

SKEW function: Description, Usage, Syntax, Examples and Explanation

by

What is SKEW function in Excel?

SKEW function is one of Statistical functions in Microsoft Excel that returns the skewness of a distribution. Skewness characterizes the degree of asymmetry of a distribution around its mean. Positive skewness indicates a distribution with an asymmetric tail extending toward more positive values. Negative skewness indicates a distribution with an asymmetric tail extending toward more negative values.

Syntax of SKEW function

SKEW(number1, [number2], …)

The SKEW function syntax has the following arguments:

  • Number1, number2, …    Number1 is required, subsequent numbers are optional. 1 to 255 arguments for which you want to calculate skewness. You can also use a single array or a reference to an array instead of arguments separated by commas.

Explanation of SKEW function

  • Arguments can either be numbers or names, arrays, or references that contain numbers.
  • Logical values and text representations of numbers that you type directly into the list of arguments are counted.
  • If an array or reference argument contains text, logical values, or empty cells, those values are ignored; however, cells with the value zero are included.
  • Arguments that are error values or text that cannot be translated into numbers cause errors.
  • If there are fewer than three data points, or the sample standard deviation is zero, SKEW returns the #DIV/0! error value.
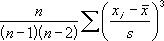
  • The equation for skewness is defined as:Equation

Example of SKEW function

Steps to follow:

1. Open a new Excel worksheet.

2. Copy data in the following table below and paste it in cell A1

Note: For formulas to show results, select them, press F2 key on your keyboard and then press Enter.

You can adjust the column widths to see all the data, if need be.

Data
3
4
5
2
3
4
5
6
4
7
Formula Description Result
=SKEW(A2:A11) Skewness of a distribution of the data set in A2:A11. 0.359543

Post navigation

Previous Post:

How to generate random date between two dates in Excel

Leave a Reply Cancel reply

Your email address will not be published. Required fields are marked *

Learn Basic Excel

Ribbon
Workbook
Worksheets
Format Cells
Find & Select
Sort & Filter
Templates
Print
Share
Protect
Keyboard Shortcuts

Categories

  • Charts
  • Data Analysis
  • Data Validation
  • Excel Functions
    • Cube Functions
    • Database Functions
    • Date and Time Functions
    • Engineering Functions
    • Financial Functions
    • Information Functions
    • Logical Functions
    • Lookup and Reference Functions
    • Math and Trig Functions
    • Statistical Functions
    • Text Functions
    • Web Functions
  • Excel VBA
  • Excel Video Tutorials
  • Formatting
  • Grouping
  • Others

Logical Functions

  • AND function: Description, Usage, Syntax, Examples and Explanation
  • IFS function: Description, Usage, Syntax, Examples and Explanation
  • TRUE function: Description, Usage, Syntax, Examples and Explanation
  • SWITCH function: Description, Usage, Syntax, Examples and Explanation
  • XOR function: Description, Usage, Syntax, Examples and Explanation

Date Time

  • Find Last Day of the Month in Excel
  • WEEKNUM function: Description, Usage, Syntax, Examples and Explanation
  • How to calculate next scheduled event in Excel
  • Get work hours between dates custom schedule in Excel
  • HOUR function: Description, Usage, Syntax, Examples and Explanation

Grouping

  • Running count group by n size in Excel
  • If cell contains one of many things in Excel
  • Group numbers with VLOOKUP in Excel
  • Categorize text with keywords in Excel
  • How to randomly assign data to groups in Excel

General

  • Index and match on multiple columns in Excel
  • How to increase by percentage in Excel
  • Check if multiple cells have same value with case sensitive in Excel
  • How to generate random times at specific intervals in Excel
  • How to generate random number weighted probability in Excel
© 2025 xlsoffice . All Right Reserved. | Teal Smiles | Abbreviations And Their Meaning