
Move chart to a separate worksheet in Excel
So far we have only seen charts on the same worksheet as the source data (embedded charts). However, you can also move a chart to a separate sheet that only contains a chart (chart sheet).
To move a chart to a chart sheet, execute the following steps.
1. Select the chart.
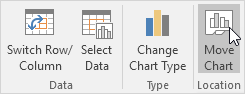
2. On the Design tab, in the Location group, click Move Chart.
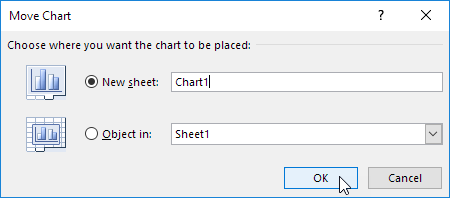
The Move Chart dialog box appears.
3. Click New sheet and enter a name.
4. Click OK.
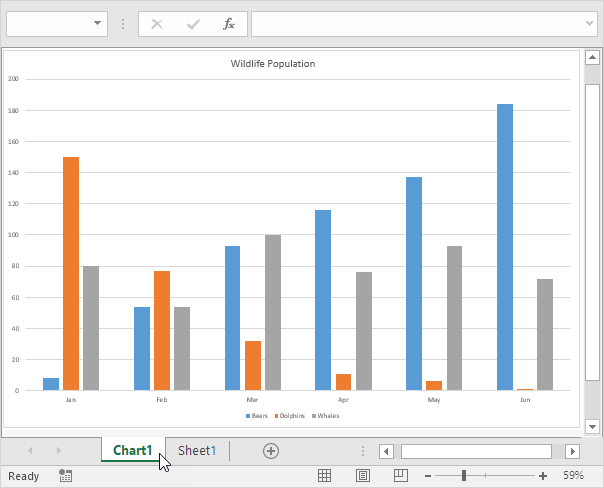
Result:
Note: repeat these steps, but instead of New sheet at step 3, click Object in, to move the chart back to the same worksheet as the source data.