Skip to content
Free Excel Tutorials
  • Home
  • Excel For Beginners
  • Excel Intermediate
  • Advanced Excel For Experts

Data Analysis

  • Understanding Pivot Tables in Excel
  • Add Outline to Data in Excel
  • Conditional Formatting New Rule with Formulas in Excel
  • Create Scatter Chart in Excel
  • Number and Text Filters Examples in Excel

References

  • Multi-criteria lookup and transpose in Excel
  • Lookup entire row in Excel
  • Count rows that contain specific values in Excel
  • VLOOKUP function: Description, Usage, Syntax, Examples and Explanation
  • How to use Excel ROWS Function

Data Validations

  • Excel Data validation date in next 30 days
  • Excel Data validation specific characters only
  • Excel Data validation no punctuation
  • Excel Data validation number multiple 100
  • Excel Data validation whole percentage only

Managing Conditional Formatting Rules in Excel

by

Manage Rules enables users click New Rule, Edit Rule and Delete Rule to create, edit and delete rules in Conditional Formatting in Excel.

To view all conditional formatting rules in a workbook, use the Conditional Formatting Rules Manager. You can also use this screen to create, edit and delete rules.
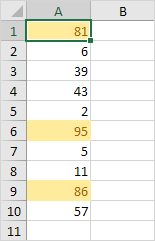
1. Select cell A1.

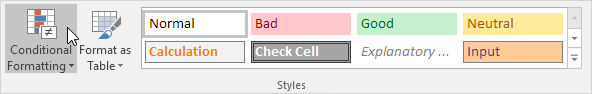
2. On the Home tab, in the Styles group, click Conditional Formatting.

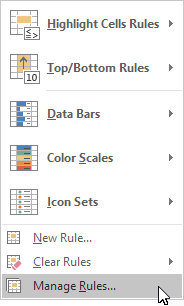
3. Click Manage Rules.

The Conditional Formatting Rules Manager appears.

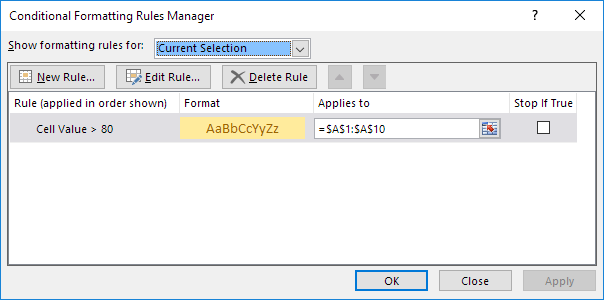
Note: because we selected cell A1, Excel shows the rule applied to the range A1:A10.

4. From the drop-down list, change Current Selection to This Worksheet, to view all conditional formatting rules in this worksheet.

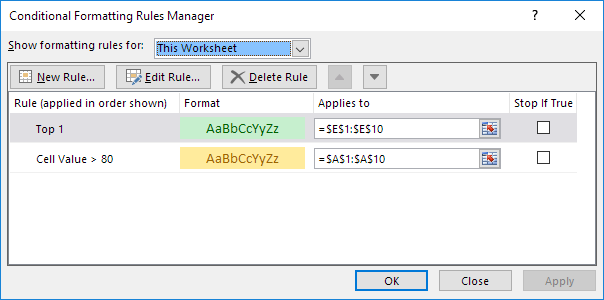
Note: click New Rule, Edit Rule and Delete Rule to create, edit and delete rules.

Post navigation

Previous Post:

TRUE function: Description, Usage, Syntax, Examples and Explanation

Next Post:

Excel Pie Chart

Leave a Reply Cancel reply

Your email address will not be published. Required fields are marked *

Learn Basic Excel

Ribbon
Workbook
Worksheets
Format Cells
Find & Select
Sort & Filter
Templates
Print
Share
Protect
Keyboard Shortcuts

Categories

  • Charts
  • Data Analysis
  • Data Validation
  • Excel Functions
    • Cube Functions
    • Database Functions
    • Date and Time Functions
    • Engineering Functions
    • Financial Functions
    • Information Functions
    • Logical Functions
    • Lookup and Reference Functions
    • Math and Trig Functions
    • Statistical Functions
    • Text Functions
    • Web Functions
  • Excel VBA
  • Excel Video Tutorials
  • Formatting
  • Grouping
  • Others

Logical Functions

  • Not Equal To ‘<>‘ operator in Excel
  • IF function: Description, Usage, Syntax, Examples and Explanation
  • TRUE function: Description, Usage, Syntax, Examples and Explanation
  • How to use Excel OR Function
  • OR function: Description, Usage, Syntax, Examples and Explanation

Date Time

  • Get last day of month in Excel
  • How to calculate percent of year complete in Excel
  • How to Calculate Age in Excel
  • Get date from day number in Excel
  • Generate series of dates by weekends in Excel

Grouping

  • Group numbers with VLOOKUP in Excel
  • Running count group by n size in Excel
  • Group times into 3 hour buckets in Excel
  • How to randomly assign people to groups in Excel
  • Group numbers at uneven intervals in Excel

General

  • Subtotal by invoice number in Excel
  • How to get random value from list or table in Excel
  • Currency vs Accounting Format in Excel
  • Cell References: Relative, Absolute and Mixed Referencing Examples
  • 3D SUMIF for multiple worksheets in Excel
© 2026 xlsoffice . All Right Reserved. | Teal Smiles | Abbreviations And Their Meaning