Skip to content
Free Excel Tutorials
  • Home
  • Excel For Beginners
  • Excel Intermediate
  • Advanced Excel For Experts

Data Analysis

  • How to Create Column Chart in Excel
  • Conditional Formatting Color Scales Examples in Excel
  • How to count table columns in Excel
  • How to do a t-Test in Excel?
  • Move chart to a separate worksheet in Excel

References

  • VLOOKUP function: Description, Usage, Syntax, Examples and Explanation
  • How to get last row in mixed data with blanks in Excel
  • How to use Excel INDIRECT Function
  • How to use Excel COLUMN Function
  • How to create dynamic named range with OFFSET in Excel

Data Validations

  • Excel Data validation date in next 30 days
  • How To Create Drop-down List in Excel
  • Excel Data validation must not contain
  • Excel Data validation don’t exceed total
  • Excel Data validation allow weekday only

Excel Frequency Function Example

by

The FREQUENCY function in Excel calculates how often values occur within the ranges you specify in a bin table. You can also use the COUNTIFS function to create a frequency distribution.

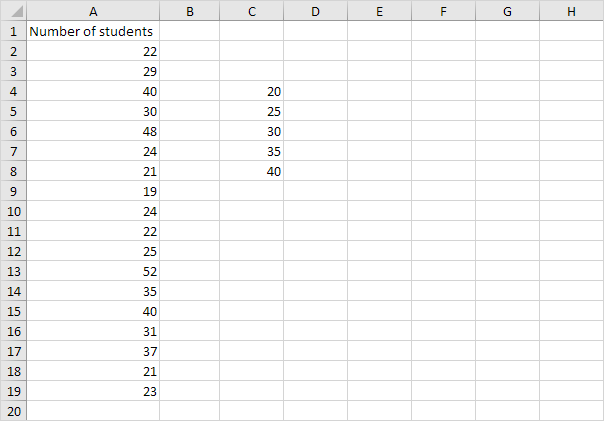
1. First, enter the bin numbers (upper levels) in the range C4:C8.

2. Select the range D4:D9 (extra cell), enter the FREQUENCY function shown below and finish by pressing CTRL + SHIFT + ENTER.

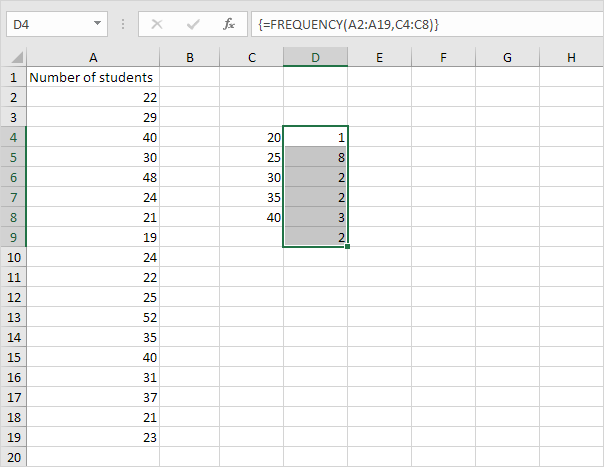
Note: the formula bar indicates that this is an array formula by enclosing it in curly braces {}. Do not type these yourself. To delete this array formula, select the range D4:D9 and press Delete.

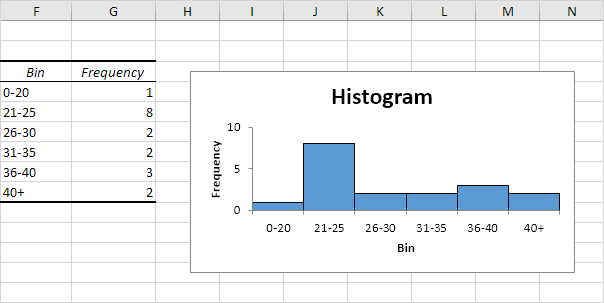
3. Hide the column with the bin numbers (upper levels) and insert a column with proper bin labels.

Explanation: 1 value is less than or equal to 20, 8 values are greater than or equal to 21 and less than or equal to 25, etc. At step 2, we selected the range D4:D9 (instead of the range D4:D8). As a result, the FREQUENCY function also counts the number of values that are greater than 40.

4. You can also use the Analysis Toolpak to create a histogram.

5. Change the bin numbers. Select the range D4:D9 (no extra cell), enter the FREQUENCY function shown below and finish by pressing CTRL + SHIFT + ENTER.

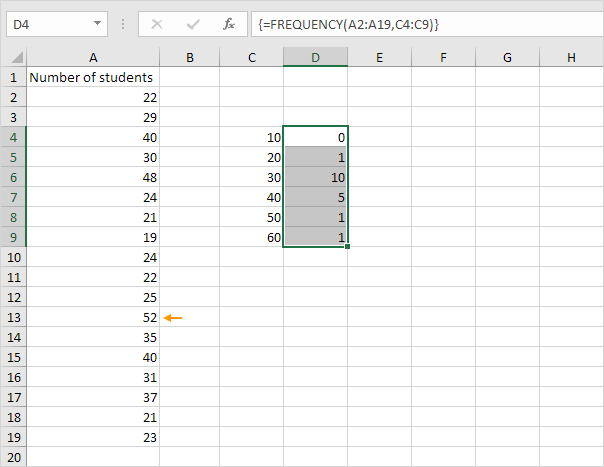
Explanation: the last bin number is greater than or equal to the maximum value (52). As a result, we don’t need an extra cell to count the number of values that are greater than 60.

6. You can also use the COUNTIFS function to create a frequency distribution.

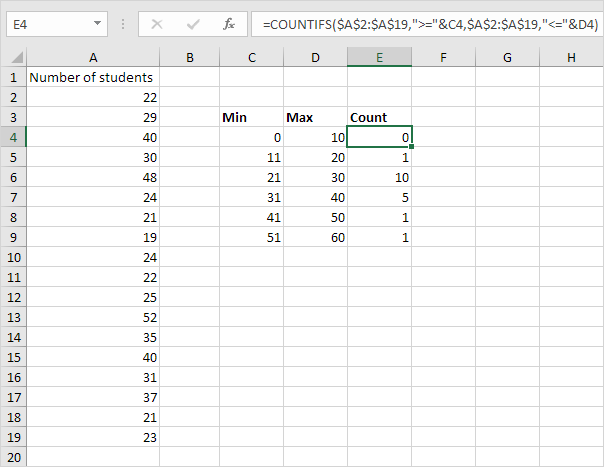
Explanation: the COUNTIFS function in Excel counts cells based on two or more criteria. The COUNTIFS function shown above has 2 range/criteria pairs. We used the & operator to concatenate “>=” with the value in cell C4 and “<=” with the value in cell D4. You can easily copy this formula to the other cells.

Post navigation

Previous Post:

VLOOKUP without #N/A error in Excel

Next Post:

Manipulating text strings using Left, Mid, Right, Len, Substitute in Excel

Leave a Reply Cancel reply

Your email address will not be published. Required fields are marked *

Learn Basic Excel

Ribbon
Workbook
Worksheets
Format Cells
Find & Select
Sort & Filter
Templates
Print
Share
Protect
Keyboard Shortcuts

Categories

  • Charts
  • Data Analysis
  • Data Validation
  • Excel Functions
    • Cube Functions
    • Database Functions
    • Date and Time Functions
    • Engineering Functions
    • Financial Functions
    • Information Functions
    • Logical Functions
    • Lookup and Reference Functions
    • Math and Trig Functions
    • Statistical Functions
    • Text Functions
    • Web Functions
  • Excel VBA
  • Excel Video Tutorials
  • Formatting
  • Grouping
  • Others

Logical Functions

  • How to use Excel AND Function
  • FALSE function: Description, Usage, Syntax, Examples and Explanation
  • How to use Excel XOR Function
  • SWITCH function: Description, Usage, Syntax, Examples and Explanation
  • IF with wildcards in Excel

Date Time

  • Calculate number of hours between two times in Excel
  • Add workdays to date custom weekends in Excel
  • Convert decimal seconds to Excel time
  • How to calculate next day of week in Excel
  • How to calculate workdays per month in Excel

Grouping

  • Group numbers at uneven intervals in Excel
  • How to randomly assign data to groups in Excel
  • Running count group by n size in Excel
  • If cell contains one of many things in Excel
  • Group times into unequal buckets in Excel

General

  • Basic numeric sort formula in Excel
  • How to Delete Cells, Row and Rows in Excel
  • How to calculate total from percentage in Excel
  • How to get amount with percentage in Excel
  • How to calculate percentage discount in Excel
© 2025 xlsoffice . All Right Reserved. | Teal Smiles | Abbreviations And Their Meaning