Skip to content
Free Excel Tutorials
  • Home
  • Excel For Beginners
  • Excel Intermediate
  • Advanced Excel For Experts

Data Analysis

  • How to Sort by Color in Excel
  • Error Bars in Excel
  • How to create a Histogram in Excel
  • Filter Data Based on Date in Excel
  • Create Scatter Chart in Excel

References

  • How to retrieve first match between two ranges in Excel
  • Multi-criteria lookup and transpose in Excel
  • Extract all partial matches in Excel
  • Convert text string to valid reference in Excel using Indirect function
  • Count rows that contain specific values in Excel

Data Validations

  • Excel Data validation date in specific year
  • Excel Data validation only dates between
  • Excel Data validation whole percentage only
  • Excel Data validation must contain specific text
  • Prevent invalid data entering in specific cells

How To Create Budget in Excel

by

This chapter shows you one of the many powerful features Excel has to offer.

The example below illustrates how to create a budget in Excel.

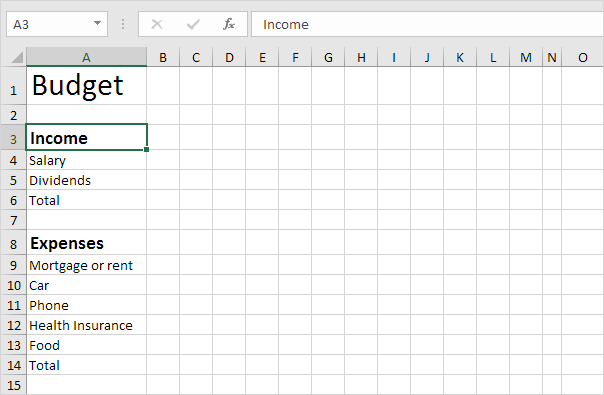
1. Enter the different type of income and expenses in column A.

Note: On the Home tab, in the Font group, you can use the different commands to change the font size and font style of text. Click on the right border of the column A header to increase the column width.

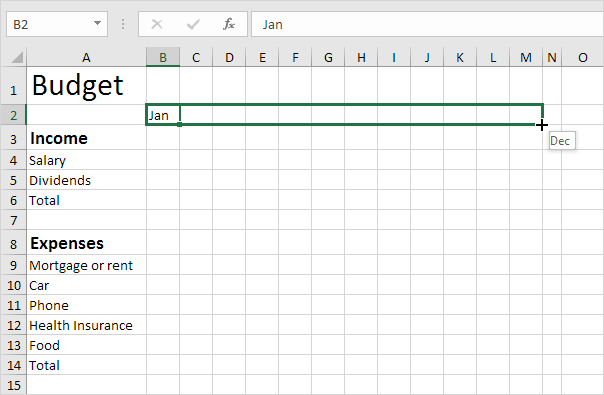
2. Enter the word Jan into cell B2. Next, select cell B2, click the lower right corner of the cell and drag it across to cell M2. Excel automatically adds the other months.
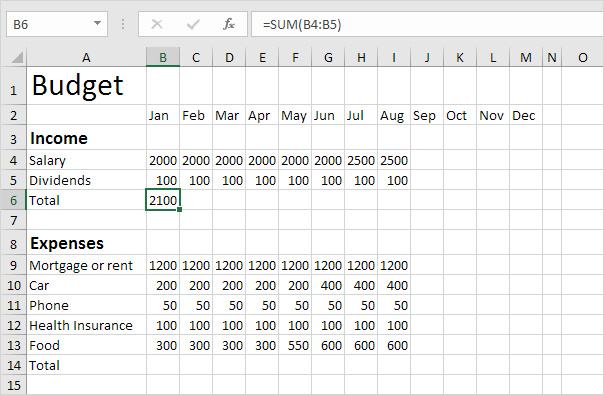
3. Enter some data.

4. Enter the SUM function into cell B6. To achieve this, select cell B6, type an equal sign (=), enter SUM(, select the range B4:B5, close with a “)” and press Enter.

Note: On the Home tab, in the Font group, you can add a top border.

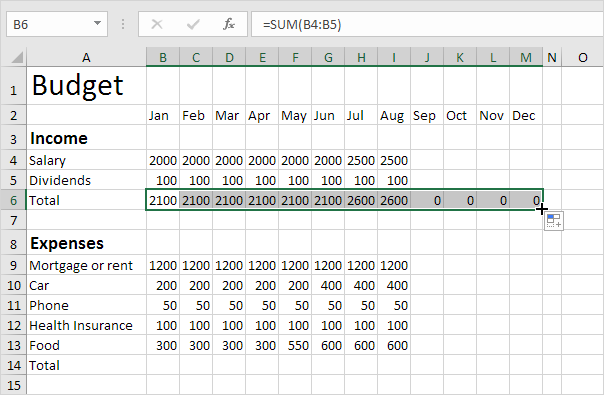
5. Select cell B6, click the lower right corner of the cell and drag it across to cell M6. Excel copies the function and border to the other cells.

6. Enter the SUM function into cell O4. Remember, select cell O4, type =SUM(, select the range B4:M4, close with a “)” and press Enter.

7. Drag cell O4 down to cell O6.

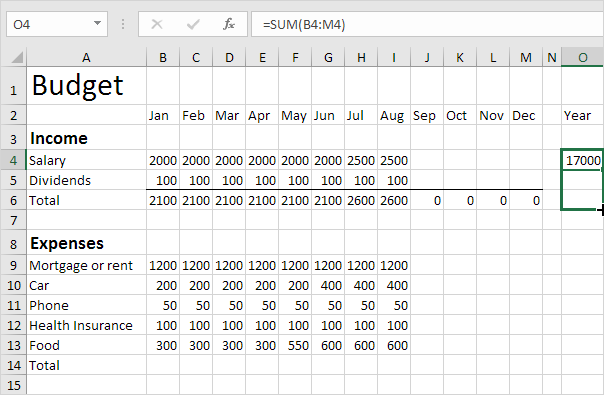
8. Repeat steps 4 to 7 for the expenses.

9. Add a Short/Extra row.

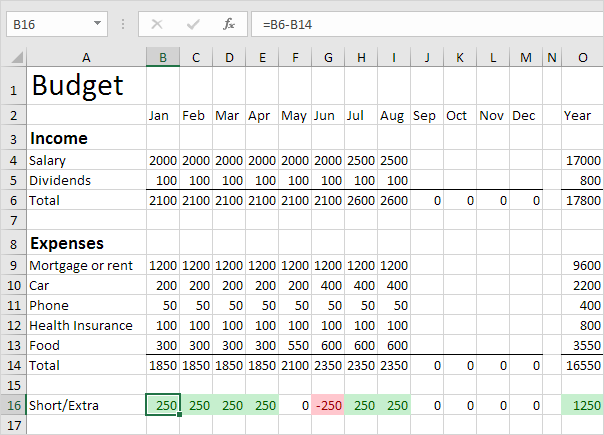
Explanation: The above example was achieved using two conditional formatting rules to highlight cells lower than 0 and greater than 0. Visit conditional formatting to learn more rules.

Post navigation

Previous Post:

VLOOKUP without #N/A error in Excel

Next Post:

Manipulating text strings using Left, Mid, Right, Len, Substitute in Excel

Leave a Reply Cancel reply

Your email address will not be published. Required fields are marked *

Learn Basic Excel

Ribbon
Workbook
Worksheets
Format Cells
Find & Select
Sort & Filter
Templates
Print
Share
Protect
Keyboard Shortcuts

Categories

  • Charts
  • Data Analysis
  • Data Validation
  • Excel Functions
    • Cube Functions
    • Database Functions
    • Date and Time Functions
    • Engineering Functions
    • Financial Functions
    • Information Functions
    • Logical Functions
    • Lookup and Reference Functions
    • Math and Trig Functions
    • Statistical Functions
    • Text Functions
    • Web Functions
  • Excel VBA
  • Excel Video Tutorials
  • Formatting
  • Grouping
  • Others

Logical Functions

  • IF, AND, OR and NOT Functions Examples in Excel
  • OR function: Description, Usage, Syntax, Examples and Explanation
  • How to use Excel NOT Function
  • NOT function: Description, Usage, Syntax, Examples and Explanation
  • How to use Excel XOR Function

Date Time

  • Calculate days remaining in Excel
  • Convert text timestamp into time in Excel
  • Calculate total hours that fall between two times in Excel
  • Add workdays to date custom weekends in Excel
  • How to get Weekdays, Working days between Two Dates in Excel

Grouping

  • Map inputs to arbitrary values in Excel
  • How to randomly assign data to groups in Excel
  • Group times into 3 hour buckets in Excel
  • If cell contains one of many things in Excel
  • Group arbitrary text values in Excel

General

  • Select, Insert, Rename, Move, Delete Worksheets in Excel
  • How to calculate profit margin percentage in Excel
  • 3D SUMIF for multiple worksheets in Excel
  • Print Excel Sheet In Landscape Or Portrait
  • How to calculate percent sold in Excel
© 2025 xlsoffice . All Right Reserved. | Teal Smiles | Abbreviations And Their Meaning