Skip to content
Free Excel Tutorials
  • Home
  • Excel For Beginners
  • Excel Intermediate
  • Advanced Excel For Experts

Data Analysis

  • Reverse List in Excel
  • Conditional Formatting Color Scales Examples in Excel
  • Get column name from index in Excel Table
  • How to Create One and Two Variable Data Tables in Excel
  • Number and Text Filters Examples in Excel

References

  • Two-way lookup with VLOOKUP in Excel
  • To count total rows in a range in Excel
  • Multi-criteria lookup and transpose in Excel
  • How to use Excel INDIRECT Function
  • How to use Excel MMULT Function

Data Validations

  • Excel Data validation date in specific year
  • Excel Data validation must not contain
  • Excel Data validation allow uppercase only
  • Excel Data validation unique values only
  • Excel Data validation with conditional list

Excel Standard Deviation

by

What is Standard Deviation (STDEV.P, STDEV.S)?

This page explains how to calculate the standard deviation based on the entire population using the STDEV.P function in Excel and how to estimate the standard deviation based on a sample using the STDEV.S function in Excel.

What is Standard Deviation?

Standard deviation is a number that tells you how far numbers are from their mean.

1. For example, the numbers below have a mean (average) of 10.

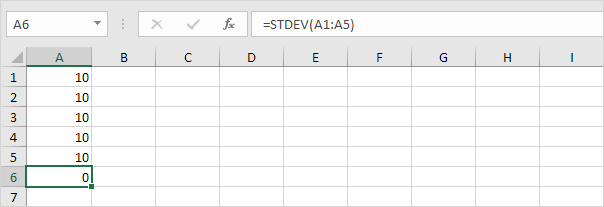
Explanation: the numbers are all the same which means there’s no variation. As a result, the numbers have a standard deviation of zero. The STDEV function is an old function. Microsoft Excel recommends using the new STEDV.S function which produces the exact same result.

2. The numbers below also have a mean (average) of 10.

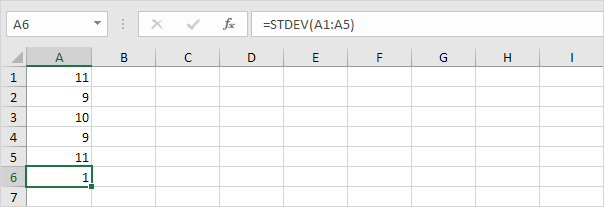
Explanation: the numbers are close to the mean. As a result, the numbers have a low standard deviation.

3. The numbers below also have a mean (average) of 10.

Explanation: the numbers are spread out. As a result, the numbers have a high standard deviation.

STDEV.P

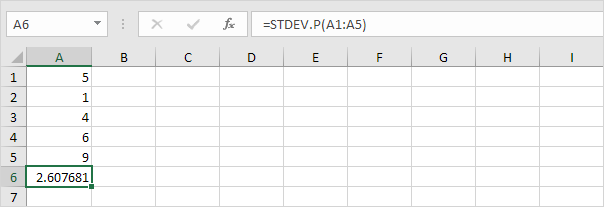
The STDEV.P function (the P stands for Population) in Excel calculates the standard deviation based on the entire population. For example, you’re teaching a group of 5 students. You have the test scores of all students. The entire population consists of 5 data points. The STDEV.P function uses the following formula:

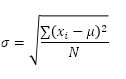
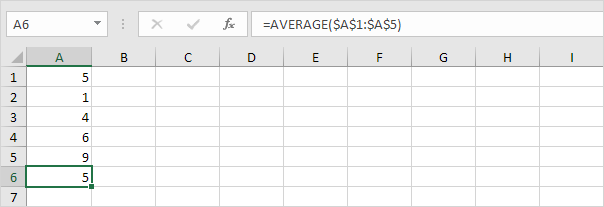
In this example, x1 = 5, x2 = 1, x3 = 4, x4 = 6, x5 = 9, μ = 5 (mean), N = 5 (number of data points).

1. Calculate the mean (μ).

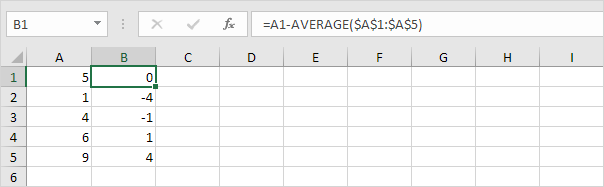
2. For each number, calculate the distance to the mean.

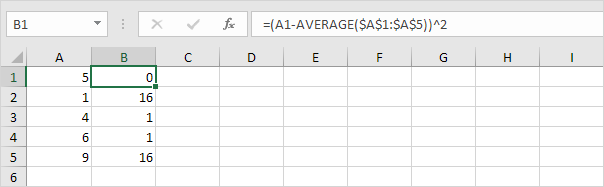
3. For each number, square this distance.

4. Sum (∑) these values.

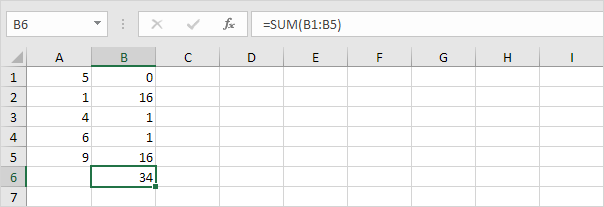
5. Divide by the number of data points (N = 5).

6. Take the square root.

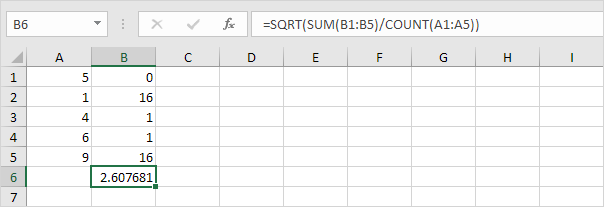
7. Fortunately, the STDEV.P function in Excel can execute all these steps for you.

STDEV.S

The STDEV.S function (the S stands for Sample) in Excel estimates the standard deviation based on a sample. For example, you’re teaching a large group of students. You only have the test scores of 5 students. The sample size equals 5. The STDEV.S function uses the following formula:

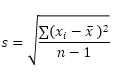
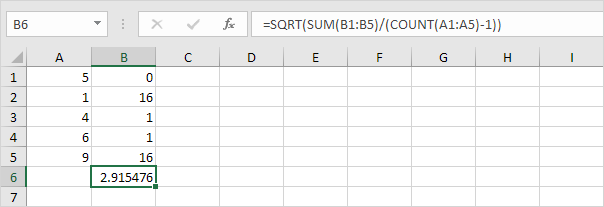
In this example, x1=5, x2=1, x3=4, x4=6, x5=9 (same numbers as above), x̄=5 (sample mean), n=5 (sample size).

1. Repeat steps 1-5 above but at step 5 divide by n-1 instead of N.

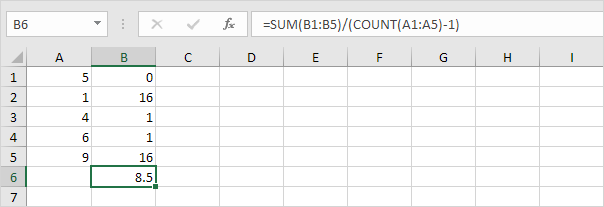
2. Take the square root.

3. Fortunately, the STDEV.S function in Excel can execute all these steps for you.

Note: why do we divide by n – 1 instead of by n when we estimate the standard deviation based on a sample? Bessel’s correction states that dividing by n-1 instead of by n gives a better estimation of the standard deviation.

Post navigation

Previous Post:

COSH function: Description, Usage, Syntax, Examples and Explanation

Next Post:

Excel Data validation require unique number

Leave a Reply Cancel reply

Your email address will not be published. Required fields are marked *

Learn Basic Excel

Ribbon
Workbook
Worksheets
Format Cells
Find & Select
Sort & Filter
Templates
Print
Share
Protect
Keyboard Shortcuts

Categories

  • Charts
  • Data Analysis
  • Data Validation
  • Excel Functions
    • Cube Functions
    • Database Functions
    • Date and Time Functions
    • Engineering Functions
    • Financial Functions
    • Information Functions
    • Logical Functions
    • Lookup and Reference Functions
    • Math and Trig Functions
    • Statistical Functions
    • Text Functions
    • Web Functions
  • Excel VBA
  • Excel Video Tutorials
  • Formatting
  • Grouping
  • Others

Logical Functions

  • IF with wildcards in Excel
  • Nested IF function example in Excel
  • How to use Excel OR Function
  • IF function: Description, Usage, Syntax, Examples and Explanation
  • How to use Excel NOT Function

Date Time

  • How to get number of days, weeks, months or years between two dates in Excel
  • Roll back weekday to Friday base on a particular date in Excel
  • NOW function: Description, Usage, Syntax, Examples and Explanation
  • WORKDAY.INTL function: Description, Usage, Syntax, Examples and Explanation
  • Series of dates by day

Grouping

  • Group numbers with VLOOKUP in Excel
  • Map inputs to arbitrary values in Excel
  • Categorize text with keywords in Excel
  • How to randomly assign data to groups in Excel
  • If cell contains one of many things in Excel

General

  • How to create dynamic worksheet reference in Excel
  • Convert column number to letter in Excel
  • How to generate random number weighted probability in Excel
  • How to calculate percent sold in Excel
  • How to get Excel workbook path only
© 2025 xlsoffice . All Right Reserved. | Teal Smiles | Abbreviations And Their Meaning