Skip to content
Free Excel Tutorials
  • Home
  • Excel For Beginners
  • Excel Intermediate
  • Advanced Excel For Experts

Data Analysis

  • How to calculate correlation coefficient Correlation in Excel
  • How To Load Analysis ToolPak in Excel
  • Understanding Anova in Excel
  • How To Perform and Interpret Regression Analysis in Excel
  • How to Create Thermometer Chart in Excel

References

  • How to get last column number in range in Excel
  • Count rows that contain specific values in Excel
  • How to use Excel MMULT Function
  • Left Lookup in Excel
  • How to calculate two-way lookup VLOOKUP in Excel Table

Data Validations

  • Excel Data validation unique values only
  • Excel Data validation must begin with
  • Excel Data validation date in specific year
  • Excel Data validation whole percentage only
  • Prevent invalid data entering in specific cells

How to calculate compound interest in Excel

by

To calculate compound interest in Excel, you can use the FV function.

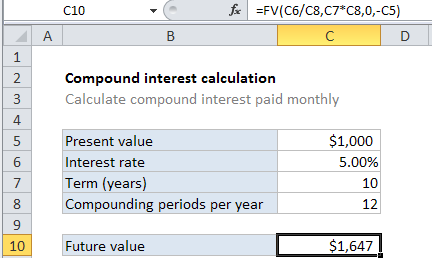
Case study: This example assumes that $1000 is invested for 10 years at an annual interest rate of 5%, compounded monthly.

Formula

=FV(rate,nper,pmt,pv)

Explanation

In the example shown, the formula in C10 is:

=FV(C6/C8,C7*C8,0,-C5)

How this formula works

The FV function can calculate compound interest and return the future value of an investment. To configure the function, we need to provide a rate, the number of periods, the periodic payment, the present value.

To get the rate (which is the period rate) we use the annual rate / periods, or C6/C8.

To get the number of periods (nper) we use term * periods, or C7 * C8.

There is no periodic payment, so we use zero.

By convention, the present value (pv) is input as a negative value, since the $1000  “leaves your wallet” and goes to the bank during the term.

The solution goes like this this:

=FV(C6/C8,C7*C8,0,-C5)
=FV(0.05/12,10*12,0,-1000)
=FV(0.00417,120,0,-1000)
=1647

Post navigation

Previous Post:

DECIMAL function: Description, Usage, Syntax, Examples and Explanation

Next Post:

AVERAGE function: Description, Usage, Syntax, Examples and Explanation

Leave a Reply Cancel reply

Your email address will not be published. Required fields are marked *

Learn Basic Excel

Ribbon
Workbook
Worksheets
Format Cells
Find & Select
Sort & Filter
Templates
Print
Share
Protect
Keyboard Shortcuts

Categories

  • Charts
  • Data Analysis
  • Data Validation
  • Excel Functions
    • Cube Functions
    • Database Functions
    • Date and Time Functions
    • Engineering Functions
    • Financial Functions
    • Information Functions
    • Logical Functions
    • Lookup and Reference Functions
    • Math and Trig Functions
    • Statistical Functions
    • Text Functions
    • Web Functions
  • Excel VBA
  • Excel Video Tutorials
  • Formatting
  • Grouping
  • Others

Logical Functions

  • Return blank if in Excel
  • Extract multiple matches into separate rows in Excel
  • Invoice status with nested if in Excel
  • How to use Excel NOT Function
  • SWITCH function: Description, Usage, Syntax, Examples and Explanation

Date Time

  • Calculate expiration date in Excel
  • Get month name from date in Excel
  • Get fiscal quarter from date in Excel
  • EDATE function: Description, Usage, Syntax, Examples and Explanation
  • Get days, hours, and minutes between dates in Excel

Grouping

  • How to randomly assign data to groups in Excel
  • Map text to numbers in Excel
  • Group times into 3 hour buckets in Excel
  • Group times into unequal buckets in Excel
  • Group arbitrary text values in Excel

General

  • How to calculate decrease by percentage in Excel
  • How to test a range for numbers in Excel
  • AutoRecover file that was never saved in Excel
  • Excel Autofill Cell Ranges, Copy, Paste
  • How to calculate percentage discount in Excel
© 2026 xlsoffice . All Right Reserved. | Teal Smiles | Abbreviations And Their Meaning