Skip to content
Free Excel Tutorials
  • Home
  • Excel For Beginners
  • Excel Intermediate
  • Advanced Excel For Experts

Data Analysis

  • How To Insert and Customize Sparklines in Excel
  • How to conditionally sum numeric data in an Excel table using SUMIFS
  • Managing Conditional Formatting Rules in Excel
  • How to create dynamic reference table name in Excel
  • Conflicting Multiple Conditional Formatting Rules in Excel

References

  • Get nth match with INDEX / MATCH in Excel
  • Last row number in range
  • How to get address of named range in Excel
  • How to calculate two-way lookup VLOOKUP in Excel Table
  • How to get last row in mixed data with blanks in Excel

Data Validations

  • Excel Data validation number multiple 100
  • Excel Data validation don’t exceed total
  • Excel Data validation unique values only
  • Excel Data validation date in next 30 days
  • Excel Data validation with conditional list

How to calculate percent sold in Excel

by

To calculate percentage sold, you can use a simple formula that divides sold amount by the total amount.

Formula

=sold/total


Note: when working manually, percentage results are calculated by dividing one number by another, then multiplying by 100 to express as a percentage. However, because Excel can display decimal or fractional values automatically as a percentage by applying the Percentage number format, there is no need to multiply by 100.

Explanation

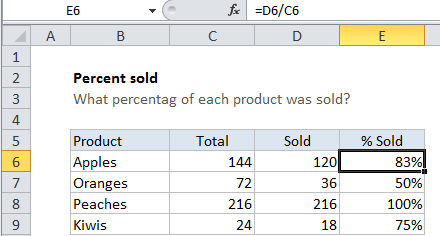
In the example shown, the formula in E6 is

=D6/C6

How this formula works

This formula simply divides the told sold by the total. In cell E6, the formula is solved like this:

=D6/C6
=120/144
=0.83333

When the result is formatted using the Percentage number format .83333 is displayed as 83%.

Post navigation

Previous Post:

DECIMAL function: Description, Usage, Syntax, Examples and Explanation

Next Post:

AVERAGE function: Description, Usage, Syntax, Examples and Explanation

Leave a Reply Cancel reply

Your email address will not be published. Required fields are marked *

Learn Basic Excel

Ribbon
Workbook
Worksheets
Format Cells
Find & Select
Sort & Filter
Templates
Print
Share
Protect
Keyboard Shortcuts

Categories

  • Charts
  • Data Analysis
  • Data Validation
  • Excel Functions
    • Cube Functions
    • Database Functions
    • Date and Time Functions
    • Engineering Functions
    • Financial Functions
    • Information Functions
    • Logical Functions
    • Lookup and Reference Functions
    • Math and Trig Functions
    • Statistical Functions
    • Text Functions
    • Web Functions
  • Excel VBA
  • Excel Video Tutorials
  • Formatting
  • Grouping
  • Others

Logical Functions

  • How to use Excel AND Function
  • AND function: Description, Usage, Syntax, Examples and Explanation
  • IF with wildcards in Excel
  • How to use Excel OR Function
  • IF function: Description, Usage, Syntax, Examples and Explanation

Date Time

  • Get first Monday before any date in Excel
  • Get first day of month in Excel
  • Calculate days remaining in Excel
  • EOMONTH function: Description, Usage, Syntax, Examples and Explanation
  • Add decimal hours to time in Excel

Grouping

  • Group times into unequal buckets in Excel
  • Calculate conditional mode with criteria in Excel
  • How to randomly assign people to groups in Excel
  • Running count group by n size in Excel
  • Map inputs to arbitrary values in Excel

General

  • Mark Workbook as Final in Excel
  • How to generate random times at specific intervals in Excel
  • Flash Fill in Excel
  • Subtotal invoices by age in Excel
  • How to test a range for numbers in Excel
© 2026 xlsoffice . All Right Reserved. | Teal Smiles | Abbreviations And Their Meaning