Skip to content
Free Excel Tutorials
  • Home
  • Excel For Beginners
  • Excel Intermediate
  • Advanced Excel For Experts

Data Analysis

  • Conditional Formatting Icon Sets Examples in Excel
  • How to calculate average last N values in a table in Excel
  • How to Create Thermometer Chart in Excel
  • Number and Text Filters Examples in Excel
  • Subtotal function in Excel

References

  • Left Lookup in Excel
  • How to use Excel FORMULATEXT function
  • Extract data with helper column in Excel
  • How to use Excel VLOOKUP Function
  • CHOOSE function: Description, Usage, Syntax, Examples and Explanation

Data Validations

  • Excel Data validation number multiple 100
  • Excel Data validation exists in list
  • Excel Data validation date in specific year
  • Excel Data validation allow uppercase only
  • Excel Data validation no punctuation

SKEW.P function: Description, Usage, Syntax, Examples and Explanation

by

What is SKEW.P function in Excel?

SKEW.P function is one of Statistical functions in Microsoft Excel that returns the skewness of a distribution based on a population: a characterization of the degree of asymmetry of a distribution around its mean.

Syntax of SKEW.P function

SKEW.P(number 1, [number 2],…)

The SKEW.P function syntax has the following arguments.

Number 1, number 2,…    Number 1 is required, subsequent numbers are optional. Number 1, number 2,… are 1 to 254 numbers or names, arrays, or reference that contain numbers for which you want the population skewness.

SKEW.P uses the following equation:

SKEW.P equation

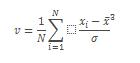
Explanation of SKEW.P function

  • Arguments can either be numbers or names, arrays, or references that contain numbers.
  • Logical values and text representations of numbers that you type directly into the list of arguments are counted.
  • If an array or reference argument contains text, logical values, or empty cells, those values are ignored; however, cells with the value zero (0) are included.
  • SKEW.P uses the standard deviation of an entire population, not a sample.
  • If arguments are values that are not valid, SKEW.P returns the #NUM! error value.
  • If arguments use data types that are not valid, SKEW.P returns the #VALUE! error value.
  • If there are fewer than three data points, or the sample standard deviation is zero, SKEW.P returns the #DIV/0! Error value.

Example of SKEW.P function

Steps to follow:

1. Open a new Excel worksheet.

2. Copy data in the following table below and paste it in cell A1

Note: For formulas to show results, select them, press F2 key on your keyboard and then press Enter.

You can adjust the column widths to see all the data, if need be.

Population Data Set
3
4
5
2
3
4
5
6
4
7
Formula Description Result
=SKEW.P(A2:A11) Skewness of a distribution based on the population of the data set in A2:A11 (0.303193). 0.303193

Post navigation

Previous Post:

How to generate random date between two dates in Excel

Leave a Reply Cancel reply

Your email address will not be published. Required fields are marked *

Learn Basic Excel

Ribbon
Workbook
Worksheets
Format Cells
Find & Select
Sort & Filter
Templates
Print
Share
Protect
Keyboard Shortcuts

Categories

  • Charts
  • Data Analysis
  • Data Validation
  • Excel Functions
    • Cube Functions
    • Database Functions
    • Date and Time Functions
    • Engineering Functions
    • Financial Functions
    • Information Functions
    • Logical Functions
    • Lookup and Reference Functions
    • Math and Trig Functions
    • Statistical Functions
    • Text Functions
    • Web Functions
  • Excel VBA
  • Excel Video Tutorials
  • Formatting
  • Grouping
  • Others

Logical Functions

  • Not Equal To ‘<>‘ operator in Excel
  • Excel If, Nested If, And/Or Criteria Examples
  • IF, AND, OR and NOT Functions Examples in Excel
  • How to use Excel OR Function
  • Invoice status with nested if in Excel

Date Time

  • Convert date to month and year in Excel
  • Dynamic date list in Excel
  • Get first day of previous month in Excel
  • NOW function: Description, Usage, Syntax, Examples and Explanation
  • Calculate expiration date in Excel

Grouping

  • Group numbers at uneven intervals in Excel
  • Running count group by n size in Excel
  • Group times into 3 hour buckets in Excel
  • Calculate conditional mode with criteria in Excel
  • How to randomly assign data to groups in Excel

General

  • How to get Excel workbook path only
  • Basic error trapping example in Excel
  • Find Most Frequently Occurring Word in Excel Worksheet
  • Transpose: Switch ‘Rows to Columns’ or ‘Columns to Rows’ in Excel
  • Print Excel Sheet In Landscape Or Portrait
© 2026 xlsoffice . All Right Reserved. | Teal Smiles | Abbreviations And Their Meaning