Skip to content
Free Excel Tutorials
  • Home
  • Excel For Beginners
  • Excel Intermediate
  • Advanced Excel For Experts

Data Analysis

  • How to count table rows in Excel
  • How to count table columns in Excel
  • Everything about Charts in Excel
  • How to calculate current stock or inventory in Excel
  • How to calculate average last N values in a table in Excel

References

  • CHOOSE function: Description, Usage, Syntax, Examples and Explanation
  • Count rows that contain specific values in Excel
  • Count unique text values with criteria
  • INDEX function: Description, Usage, Syntax, Examples and Explanation
  • Multi-criteria lookup and transpose in Excel

Data Validations

  • Excel Data validation must begin with
  • Excel Data validation must contain specific text
  • Excel Data validation must not contain
  • Excel Data validation with conditional list
  • Excel Data validation only dates between

How to Create Box and Whisker Plot in Excel

by

This example teaches you how to create a box and whisker plot in Excel.

A box and whisker chart shows distribution of data into quartiles, highlighting the mean and outliers. The boxes may have lines extending vertically called “whiskers”. These lines indicate variability outside the upper and lower quartiles, and any point outside those lines or whiskers is considered an outlier.

Simple Box and Whisker Plot

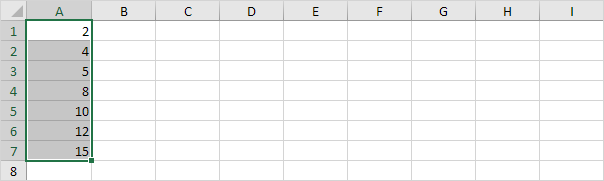
1. For example, select the range A1:A7.

odd-number-of-data-points How to Create Box and Whisker Plot in Excel

Note: you don’t have to sort the data points from smallest to largest, but it will help you understand the box and whisker plot.

2. On the Insert tab, in the Charts group, click the Statistic Chart symbol.

insert-box-whisker-plot How to Create Box and Whisker Plot in Excel

3. Click Box and Whisker.

click-box-whisker How to Create Box and Whisker Plot in Excel

Result:

simple-box-whisker-plot How to Create Box and Whisker Plot in Excel

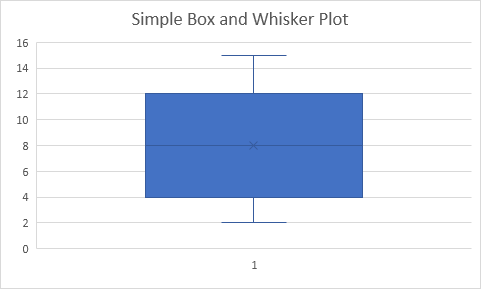
Explanation: the middle line of the box represents the median or middle number (8). The x in the box represents the mean (also 8 in this example). The median divides the data set into a bottom half {2, 4, 5} and a top half {10, 12, 15}. The bottom line of the box represents the median of the bottom half or 1st quartile (4). The top line of the box represents the median of the top half or 3rd quartile (12). The whiskers (vertical lines) extend from the ends of the box to the minimum value (2) and maximum value (15).

Outliers

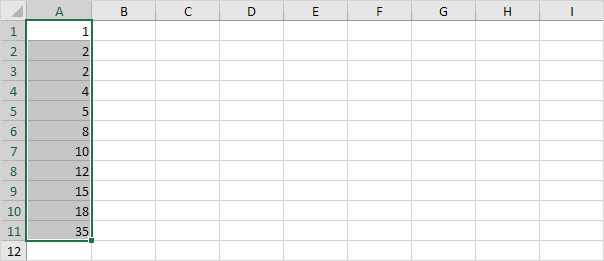
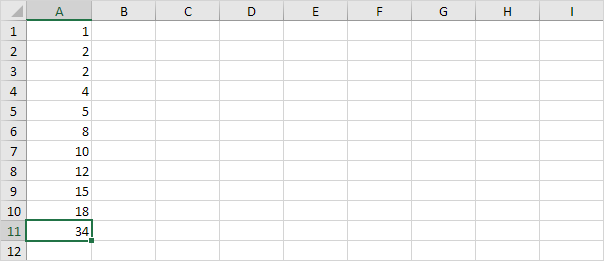
1. For example, select the range A1:A11.

data-set-with-outlier How to Create Box and Whisker Plot in Excel

Note: the median or middle number (8) divides the data set into two halves: {1, 2, 2, 4, 5} and {10, 12, 15, 18, 35}. The 1st quartile (Q1) is the median of the first half. Q1 = 2. The 3rd quartile (Q3) is the median of the second half. Q3 = 15.

2. On the Insert tab, in the Charts group, click the Statistic Chart symbol.

insert-box-whisker-plot How to Create Box and Whisker Plot in Excel

3. Click Box and Whisker.

click-box-whisker How to Create Box and Whisker Plot in Excel

Result:

box-whisker-plot-with-outlier How to Create Box and Whisker Plot in Excel

Explanation: the interquartile range (IQR) is defined as the distance between the 1st quartile and the 3rd quartile. In this example, IQR = Q3 – Q1 = 15 – 2 = 13. A data point is considered an outlier if it exceeds a distance of 1.5 times the IQR below the 1st quartile (Q1 – 1.5 * IQR = 2 – 1.5 * 13 = -17.5) or 1.5 times the IQR above the 3rd quartile (Q3 + 1.5 * IQR = 15 + 1.5 * 13 = 34.5). Therefore, in this example, 35 is considered an outlier. As a result, the top whisker extends to the largest value (18) within this range.

4. Change the last data point to 34.

change-data-point How to Create Box and Whisker Plot in Excel

Result:

box-whisker-plot-without-outlier How to Create Box and Whisker Plot in Excel

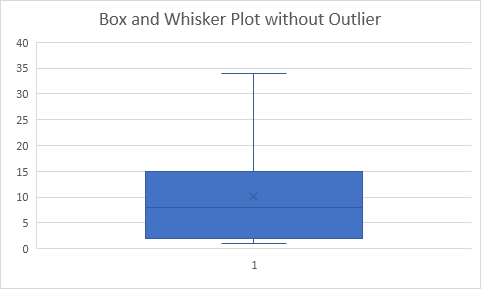
Explanation: all data points are between -17.5 and 34.5. As a result, the whiskers extend to the minimum value (2) and maximum value (34).

Box Plot Calculations

Most of the time, you can cannot easily determine the 1st quartile and 3rd quartile without performing calculations.

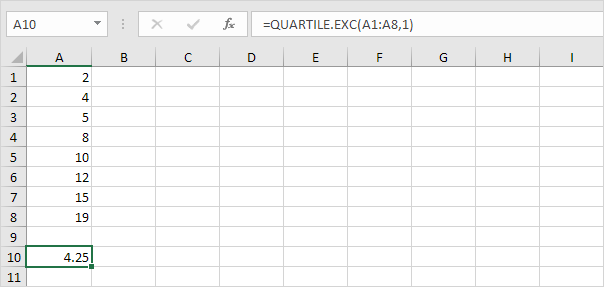
1. For example, select the even number of data points below.

even-number-of-data-points How to Create Box and Whisker Plot in Excel

2. On the Insert tab, in the Charts group, click the Statistic Chart symbol.

insert-box-whisker-plot How to Create Box and Whisker Plot in Excel

3. Click Box and Whisker.

click-box-whisker How to Create Box and Whisker Plot in Excel

Result:

box-whisker-plot How to Create Box and Whisker Plot in Excel

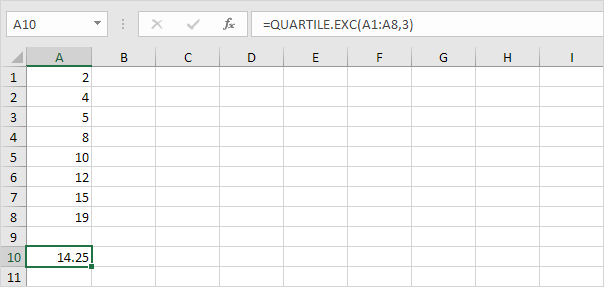
Explanation: Excel uses the QUARTILE.EXC function to calculate the 1st quartile (Q1), 2nd quartile (Q2 or median) and 3rd quartile (Q3). This function interpolates between two values to calculate a quartile. In this example, n = 8 (number of data points).

4. Q1 = 1/4*(n+1)th value = 1/4*(8+1)th value = 2 1/4th value = 4 + 1/4 * (5-4) = 4 1/4. You can verify this number by using the QUARTILE.EXC function or looking at the box and whisker plot.

first-quartile How to Create Box and Whisker Plot in Excel

5. Q2 = 1/2*(n+1)th value = 1/2*(8+1)th value = 4 1/2th value = 8 + 1/2 * (10-8) = 9. This makes sense, the median is the average of the middle two numbers.

median How to Create Box and Whisker Plot in Excel

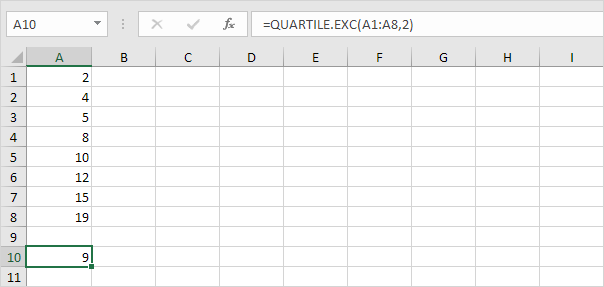
6. Q3 = 3/4*(n+1)th value = 3/4*(8+1)th value = 6 3/4th value = 12 + 3/4 * (15-12) = 14 1/4. Again, you can verify this number by using the QUARTILE.EXC function or looking at the box and whisker plot.

third-quartile How to Create Box and Whisker Plot in Excel

Post navigation

Previous Post:

VLOOKUP without #N/A error in Excel

Next Post:

Manipulating text strings using Left, Mid, Right, Len, Substitute in Excel

Leave a Reply Cancel reply

Your email address will not be published. Required fields are marked *

Learn Basic Excel

Ribbon
Workbook
Worksheets
Format Cells
Find & Select
Sort & Filter
Templates
Print
Share
Protect
Keyboard Shortcuts

Categories

  • Charts
  • Data Analysis
  • Data Validation
  • Excel Functions
    • Cube Functions
    • Database Functions
    • Date and Time Functions
    • Engineering Functions
    • Financial Functions
    • Information Functions
    • Logical Functions
    • Lookup and Reference Functions
    • Math and Trig Functions
    • Statistical Functions
    • Text Functions
    • Web Functions
  • Excel VBA
  • Excel Video Tutorials
  • Formatting
  • Grouping
  • Others

Logical Functions

  • Nested IF function example in Excel
  • NOT function: Description, Usage, Syntax, Examples and Explanation
  • Extract multiple matches into separate rows in Excel
  • IFS function: Description, Usage, Syntax, Examples and Explanation
  • IFNA function: Description, Usage, Syntax, Examples and Explanation

Date Time

  • Get last weekday in month in Excel
  • Calculate retirement date in Excel
  • Convert Unix time stamp to Excel date
  • Convert decimal seconds to Excel time
  • NETWORKDAYS.INTL function: Description, Usage, Syntax, Examples and Explanation

Grouping

  • Group arbitrary text values in Excel
  • How to randomly assign people to groups in Excel
  • Group numbers at uneven intervals in Excel
  • Group times into unequal buckets in Excel
  • Categorize text with keywords in Excel

General

  • Spell Check in Excel
  • How to generate random number between two numbers in Excel
  • List worksheet index numbers in Excel
  • How to calculate decrease by percentage in Excel
  • Subtotal by invoice number in Excel
© 2025 xlsoffice . All Right Reserved. | Teal Smiles | Abbreviations And Their Meaning