

Skip to content
Free Excel Tutorials
  • Home
  • Excel For Beginners
  • Excel Intermediate
  • Advanced Excel For Experts

Data Analysis

  • How to Create Area Chart in Excel
  • Example of COUNTIFS with variable table column in Excel
  • How to combine 2 or more chart types in a single chart in Excel
  • How to count table rows in Excel
  • Create Scatter Chart in Excel

References

  • How to use Excel TRANSPOSE Function
  • How to use Excel MMULT Function
  • How to calculate two-way lookup VLOOKUP in Excel Table
  • Basic INDEX MATCH approximate in Excel
  • How to create dynamic named range with OFFSET in Excel

Data Validations

  • Excel Data validation date in specific year
  • Excel Data validation date in next 30 days
  • Excel Data validation with conditional list
  • Excel Data validation allow weekday only
  • Excel Data validation allow uppercase only

Find Percentage Change Between Numbers

by

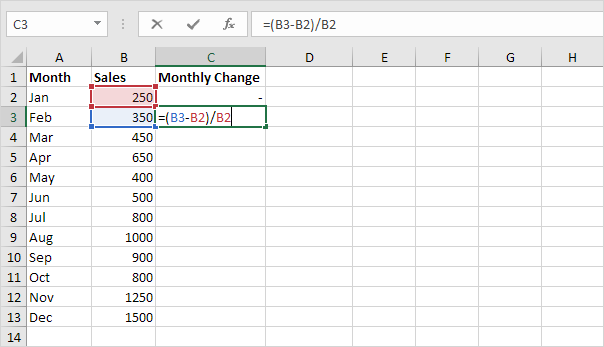
The percent change formula is used very often in Excel. For example, to calculate the Monthly Change and Total Change.

1a. Select cell C3 and enter the formula shown below.
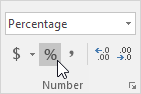
1b. Select cell C3. On the Home tab, in the Number group, apply a Percentage format.
1c. Select cell C3, click on the lower right corner of cell C3 and drag it down to cell C13.
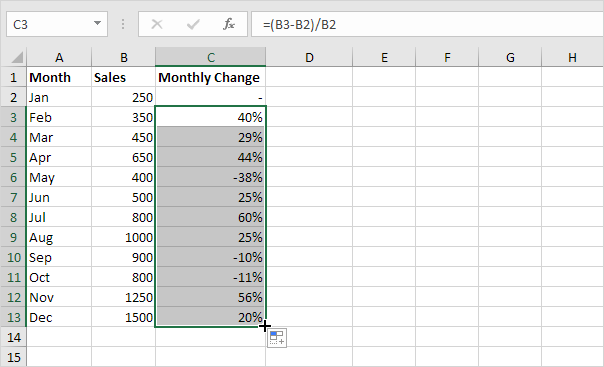
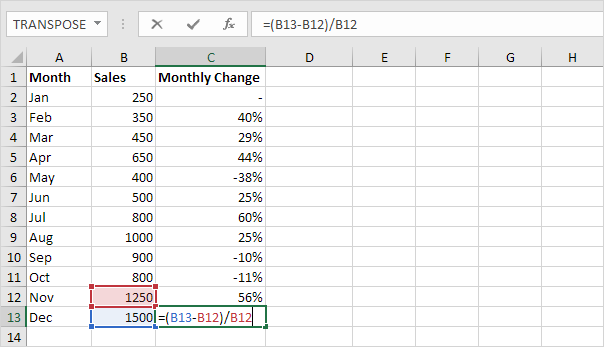
1d. Check if everything went alright.
2a. In a similar way, we can calculate the Total Change. This time we fix the reference to cell B2. Select cell D3 and enter the formula shown below.
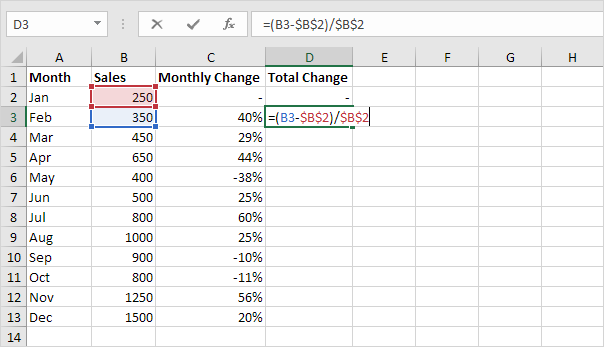
2b. Select cell D3. On the Home tab, in the Number group, apply a Percentage format.

2c. Select cell D3, click on the lower right corner of cell D3 and drag it down to cell D13.

2d. Check if everything went alright.
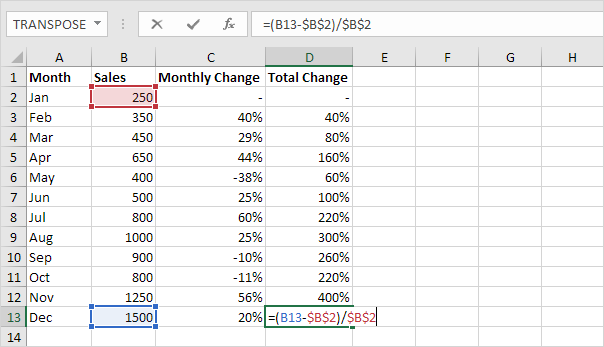
Explanation: when we drag the formula down, the absolute reference ($B$2) stays the same, while the relative reference (B3) changes to B4, B5, B6, etc.

Post navigation

Previous Post:

VLOOKUP without #N/A error in Excel

Next Post:

Manipulating text strings using Left, Mid, Right, Len, Substitute in Excel

Leave a Reply Cancel reply

Your email address will not be published. Required fields are marked *

Learn Basic Excel

Ribbon
Workbook
Worksheets
Format Cells
Find & Select
Sort & Filter
Templates
Print
Share
Protect
Keyboard Shortcuts

Categories

  • Charts
  • Data Analysis
  • Data Validation
  • Excel Functions
    • Cube Functions
    • Database Functions
    • Date and Time Functions
    • Engineering Functions
    • Financial Functions
    • Information Functions
    • Logical Functions
    • Lookup and Reference Functions
    • Math and Trig Functions
    • Statistical Functions
    • Text Functions
    • Web Functions
  • Excel VBA
  • Excel Video Tutorials
  • Formatting
  • Grouping
  • Others

Logical Functions

  • How to use Excel XOR Function
  • How to use Excel TRUE Function
  • Extract multiple matches into separate rows in Excel
  • Complete List of Excel Logical Functions, References and Examples
  • IFS function: Description, Usage, Syntax, Examples and Explanation

Date Time

  • DAYS function: Description, Usage, Syntax, Examples and Explanation
  • Get project midpoint in Excel
  • Calculate date overlap in days in Excel
  • How to calculate months between dates in Excel
  • DAY function: Description, Usage, Syntax, Examples and Explanation

Grouping

  • Group arbitrary text values in Excel
  • If cell contains one of many things in Excel
  • How to randomly assign people to groups in Excel
  • Calculate conditional mode with criteria in Excel
  • Categorize text with keywords in Excel

General

  • Excel Operators
  • Hide and Unhide Columns or Rows in Excel
  • How to count total columns in range in Excel
  • How to set or clear a print area in Excel Worksheet
  • Flash Fill in Excel
© 2026 xlsoffice . All Right Reserved. | Teal Smiles | Abbreviations And Their Meaning