Skip to content
Free Excel Tutorials
  • Home
  • Excel For Beginners
  • Excel Intermediate
  • Advanced Excel For Experts

Data Analysis

  • Create Scatter Chart in Excel
  • How to Sort by Color in Excel
  • How To Load Analysis ToolPak in Excel
  • How to do a t-Test in Excel?
  • How to Use Solver Tool in Excel

References

  • VLOOKUP function: Description, Usage, Syntax, Examples and Explanation
  • How to create dynamic named range with OFFSET in Excel
  • Basic INDEX MATCH approximate in Excel
  • Create hyperlink with VLOOKUP in Excel
  • How to get first column number in range in Excel

Data Validations

  • Excel Data validation must begin with
  • Excel Data validation no punctuation
  • Excel Data validation must contain specific text
  • Excel Data validation specific characters only
  • Excel Data validation whole percentage only

Excel Ribbon Quick Overview For Beginners

by

Ribbon in Excel Function

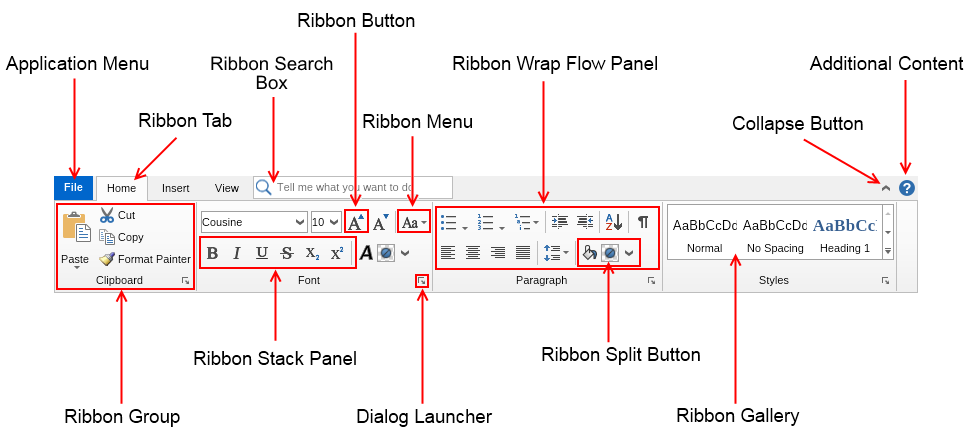
Excel ribbon is a strip of buttons and icons located above the work area that was first introduced in Excel 2007 version. The ribbon replaces the menus and toolbars found in earlier versions of Excel.

Working with and Understanding Excel Ribbon

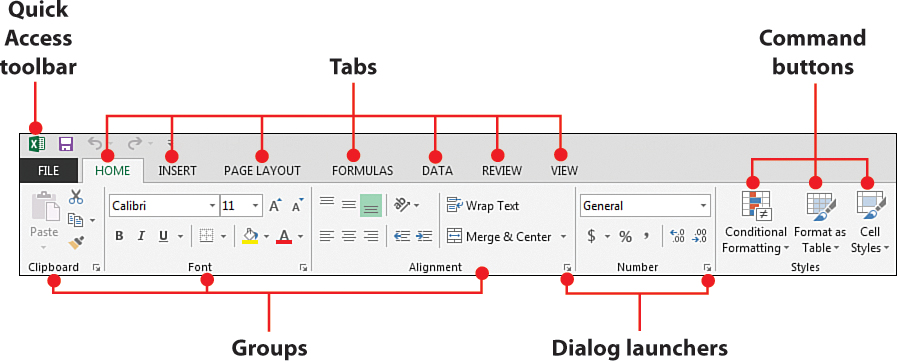
Above the ribbon are a number of tabs, such as File, Home, Insert, Page layout, Formulas, Data, Review and View as shown in the screenshot below:

Drilling down on the ribbon:

For every tab a computer user clicks,  the ribbon associated to it opens. And the ribbons are segmented  into groups. Depending on the version of excel that you are working with;  there is only a slight difference between 2007 version and 2010 -2019 versions.

File tab replaced office button in 2007.

Post navigation

Previous Post:

VLOOKUP without #N/A error in Excel

Next Post:

Manipulating text strings using Left, Mid, Right, Len, Substitute in Excel

Leave a Reply Cancel reply

Your email address will not be published. Required fields are marked *

Learn Basic Excel

Ribbon
Workbook
Worksheets
Format Cells
Find & Select
Sort & Filter
Templates
Print
Share
Protect
Keyboard Shortcuts

Categories

  • Charts
  • Data Analysis
  • Data Validation
  • Excel Functions
    • Cube Functions
    • Database Functions
    • Date and Time Functions
    • Engineering Functions
    • Financial Functions
    • Information Functions
    • Logical Functions
    • Lookup and Reference Functions
    • Math and Trig Functions
    • Statistical Functions
    • Text Functions
    • Web Functions
  • Excel VBA
  • Excel Video Tutorials
  • Formatting
  • Grouping
  • Others

Logical Functions

  • NOT function: Description, Usage, Syntax, Examples and Explanation
  • Excel If, Nested If, And/Or Criteria Examples
  • How to return blank in place of #DIV/0! error in Excel
  • XOR function: Description, Usage, Syntax, Examples and Explanation
  • How to use Excel AND Function

Date Time

  • How to get workdays between dates in Excel
  • Next biweekly payday from date in Excel
  • How to calculate months between dates in Excel
  • Pad week numbers with zeros in Excel
  • Basic Overtime Calculation Formula in Excel

Grouping

  • Group times into unequal buckets in Excel
  • Calculate conditional mode with criteria in Excel
  • Group times into 3 hour buckets in Excel
  • Running count group by n size in Excel
  • How to randomly assign data to groups in Excel

General

  • How to Create Calendar in Excel
  • Subtotal by color in Excel
  • How to calculate percent of goal in Excel
  • Excel Default Templates
  • Freeze and Unfreeze Panes in Excel
© 2026 xlsoffice . All Right Reserved. | Teal Smiles | Abbreviations And Their Meaning