Skip to content
Free Excel Tutorials
  • Home
  • Excel For Beginners
  • Excel Intermediate
  • Advanced Excel For Experts

Data Analysis

  • How to do a t-Test in Excel?
  • Example of COUNTIFS with variable table column in Excel
  • How To Perform and Interpret Regression Analysis in Excel
  • How To Insert and Customize Sparklines in Excel
  • How to conditionally sum numeric data in an Excel table using SUMIFS

References

  • CHOOSE function: Description, Usage, Syntax, Examples and Explanation
  • How to get relative row numbers in a range in Excel
  • Vlookup Examples in Excel
  • To count total rows in a range in Excel
  • How to calculate two-way lookup VLOOKUP in Excel Table

Data Validations

  • Excel Data validation unique values only
  • Excel Data validation must begin with
  • Excel Data validation with conditional list
  • Excel Data validation date in next 30 days
  • Prevent invalid data entering in specific cells

How to calculate project complete percentage in Excel

by

To calculate the percentage complete for a project with a list of tasks, you can use a simple formula based on the COUNTA function.

Formula

=COUNTA(range1)/COUNTA(range2)

Explanation

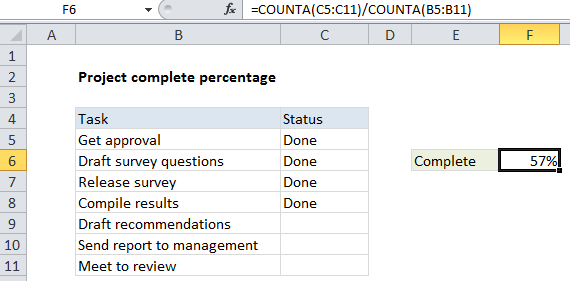
In the example shown, the formula in F6 is:

=COUNTA(C5:C11)/COUNTA(B5:B11)

How this formula works

At the core, this formula simply divides tasks complete by the total task count:

=complete/total

which is then formatted as a percentage.

To count complete tasks, we count non-blank cells in the range C5:C11:

=COUNTA(C5:C11)

To count total tasks, we count non-blank cells in the range C5:C11:

COUNTA(B5:B11)

Unlike the COUNT function, which counts only numeric values, COUNTA will count cells that include numbers or text.

Post navigation

Next Post:

Create One-dimensional and Two-dimensional Array

Leave a Reply Cancel reply

Your email address will not be published. Required fields are marked *

Learn Basic Excel

Ribbon
Workbook
Worksheets
Format Cells
Find & Select
Sort & Filter
Templates
Print
Share
Protect
Keyboard Shortcuts

Categories

  • Charts
  • Data Analysis
  • Data Validation
  • Excel Functions
    • Cube Functions
    • Database Functions
    • Date and Time Functions
    • Engineering Functions
    • Financial Functions
    • Information Functions
    • Logical Functions
    • Lookup and Reference Functions
    • Math and Trig Functions
    • Statistical Functions
    • Text Functions
    • Web Functions
  • Excel VBA
  • Excel Video Tutorials
  • Formatting
  • Grouping
  • Others

Logical Functions

  • FALSE function: Description, Usage, Syntax, Examples and Explanation
  • Not Equal To ‘<>‘ operator in Excel
  • TRUE function: Description, Usage, Syntax, Examples and Explanation
  • NOT function: Description, Usage, Syntax, Examples and Explanation
  • Nested IF function example in Excel

Date Time

  • How to get workdays between dates in Excel
  • Get date from day number in Excel
  • How to get number of days, weeks, months or years between two dates in Excel
  • Get work hours between dates custom schedule in Excel
  • How to calculate Next working/business day in Excel

Grouping

  • Group times into 3 hour buckets in Excel
  • Map text to numbers in Excel
  • How to randomly assign people to groups in Excel
  • Calculate conditional mode with criteria in Excel
  • Categorize text with keywords in Excel

General

  • How to get original number from percent change in Excel
  • Sum by group in Excel
  • Check if multiple cells have same value in Excel
  • AutoFit Column Width, AutoFit Row Height in Excel
  • 231 Keyboard Shortcut Keys In Excel
© 2025 xlsoffice . All Right Reserved. | Teal Smiles | Abbreviations And Their Meaning